Indian (Asian) vs Immigrants from Moldova Unemployment Among Ages 25 to 29 years
COMPARE
Indian (Asian)
Immigrants from Moldova
Unemployment Among Ages 25 to 29 years
Unemployment Among Ages 25 to 29 years Comparison
Indians (Asian)
Immigrants from Moldova
6.3%
UNEMPLOYMENT AMONG AGES 25 TO 29 YEARS
97.8/ 100
METRIC RATING
66th/ 347
METRIC RANK
6.5%
UNEMPLOYMENT AMONG AGES 25 TO 29 YEARS
84.5/ 100
METRIC RATING
120th/ 347
METRIC RANK
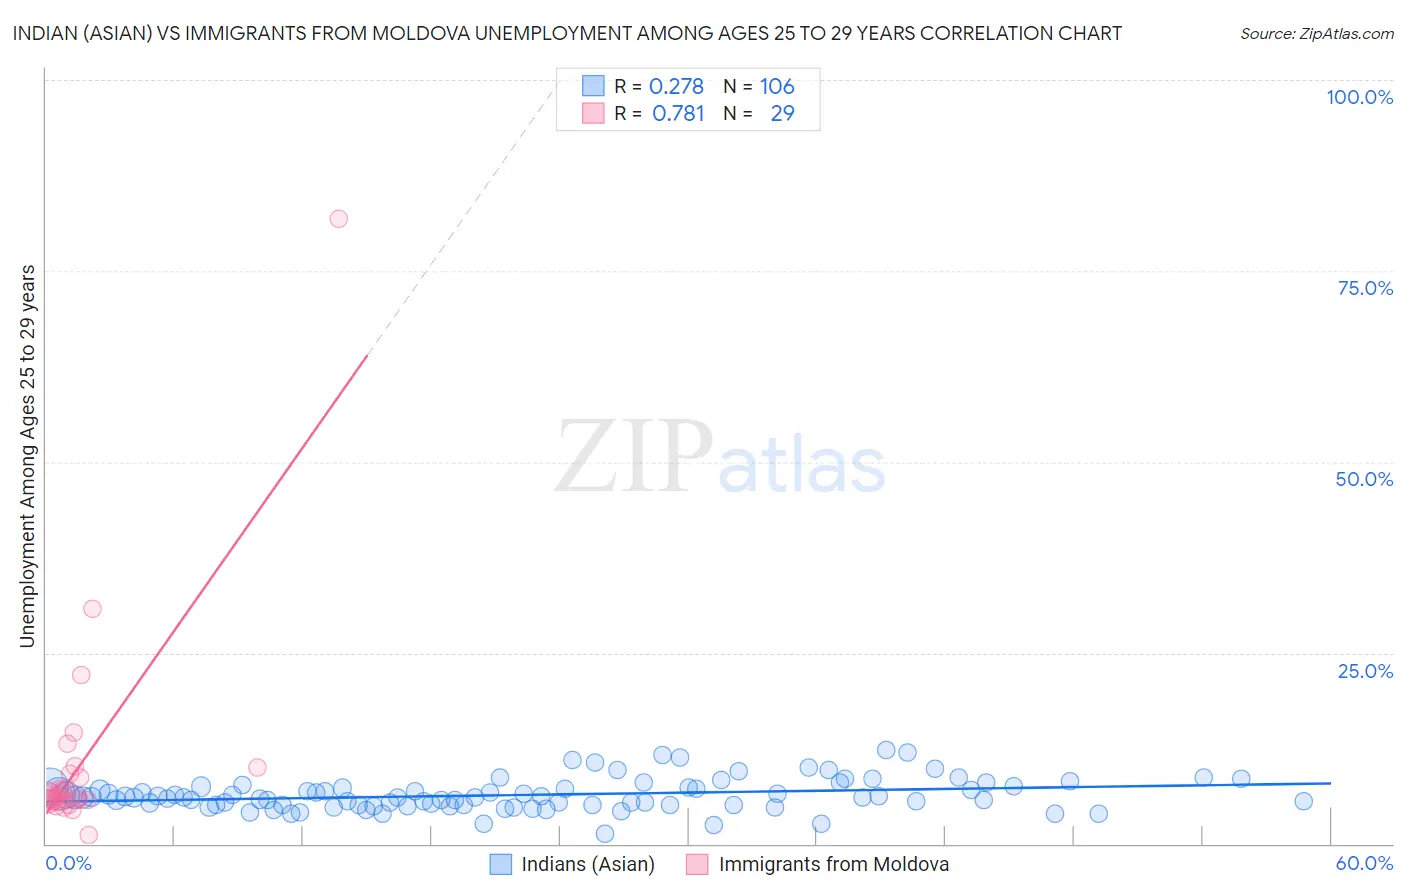
Indian (Asian) vs Immigrants from Moldova Unemployment Among Ages 25 to 29 years Correlation Chart
The statistical analysis conducted on geographies consisting of 460,677,018 people shows a weak positive correlation between the proportion of Indians (Asian) and unemployment rate among population between the ages 25 and 29 in the United States with a correlation coefficient (R) of 0.278 and weighted average of 6.3%. Similarly, the statistical analysis conducted on geographies consisting of 121,818,522 people shows a strong positive correlation between the proportion of Immigrants from Moldova and unemployment rate among population between the ages 25 and 29 in the United States with a correlation coefficient (R) of 0.781 and weighted average of 6.5%, a difference of 3.5%.
Unemployment Among Ages 25 to 29 years Correlation Summary
| Measurement | Indian (Asian) | Immigrants from Moldova |
| Minimum | 1.3% | 1.2% |
| Maximum | 12.3% | 81.8% |
| Range | 11.0% | 80.6% |
| Mean | 6.4% | 10.8% |
| Median | 6.1% | 6.2% |
| Interquartile 25% (IQ1) | 5.1% | 5.7% |
| Interquartile 75% (IQ3) | 7.4% | 9.6% |
| Interquartile Range (IQR) | 2.3% | 4.0% |
| Standard Deviation (Sample) | 2.0% | 14.8% |
| Standard Deviation (Population) | 2.0% | 14.6% |
Similar Demographics by Unemployment Among Ages 25 to 29 years
Demographics Similar to Indians (Asian) by Unemployment Among Ages 25 to 29 years
In terms of unemployment among ages 25 to 29 years, the demographic groups most similar to Indians (Asian) are Immigrants from Northern Africa (6.3%, a difference of 0.010%), Immigrants from Lebanon (6.3%, a difference of 0.020%), Palestinian (6.3%, a difference of 0.050%), Immigrants from Sri Lanka (6.3%, a difference of 0.070%), and Kenyan (6.3%, a difference of 0.12%).
| Demographics | Rating | Rank | Unemployment Among Ages 25 to 29 years |
| Luxembourgers | 98.3 /100 | #59 | Exceptional 6.2% |
| Immigrants | Taiwan | 98.3 /100 | #60 | Exceptional 6.2% |
| Bhutanese | 98.2 /100 | #61 | Exceptional 6.2% |
| Immigrants | China | 98.1 /100 | #62 | Exceptional 6.2% |
| Kenyans | 98.0 /100 | #63 | Exceptional 6.3% |
| Immigrants | Sri Lanka | 97.9 /100 | #64 | Exceptional 6.3% |
| Immigrants | Lebanon | 97.8 /100 | #65 | Exceptional 6.3% |
| Indians (Asian) | 97.8 /100 | #66 | Exceptional 6.3% |
| Immigrants | Northern Africa | 97.8 /100 | #67 | Exceptional 6.3% |
| Palestinians | 97.7 /100 | #68 | Exceptional 6.3% |
| Immigrants | Hong Kong | 97.5 /100 | #69 | Exceptional 6.3% |
| Immigrants | Malaysia | 97.5 /100 | #70 | Exceptional 6.3% |
| Immigrants | France | 97.4 /100 | #71 | Exceptional 6.3% |
| Scandinavians | 97.4 /100 | #72 | Exceptional 6.3% |
| Belgians | 97.0 /100 | #73 | Exceptional 6.3% |
Demographics Similar to Immigrants from Moldova by Unemployment Among Ages 25 to 29 years
In terms of unemployment among ages 25 to 29 years, the demographic groups most similar to Immigrants from Moldova are Immigrants from Uganda (6.5%, a difference of 0.0%), Immigrants from South Africa (6.5%, a difference of 0.050%), Immigrants from Belarus (6.5%, a difference of 0.090%), Chilean (6.5%, a difference of 0.10%), and Laotian (6.5%, a difference of 0.11%).
| Demographics | Rating | Rank | Unemployment Among Ages 25 to 29 years |
| Immigrants | Egypt | 87.1 /100 | #113 | Excellent 6.5% |
| Germans | 86.3 /100 | #114 | Excellent 6.5% |
| Macedonians | 86.1 /100 | #115 | Excellent 6.5% |
| Pakistanis | 85.9 /100 | #116 | Excellent 6.5% |
| Immigrants | Uruguay | 85.7 /100 | #117 | Excellent 6.5% |
| Chileans | 85.3 /100 | #118 | Excellent 6.5% |
| Immigrants | South Africa | 84.9 /100 | #119 | Excellent 6.5% |
| Immigrants | Moldova | 84.5 /100 | #120 | Excellent 6.5% |
| Immigrants | Uganda | 84.5 /100 | #121 | Excellent 6.5% |
| Immigrants | Belarus | 83.7 /100 | #122 | Excellent 6.5% |
| Laotians | 83.6 /100 | #123 | Excellent 6.5% |
| Arabs | 82.5 /100 | #124 | Excellent 6.5% |
| Syrians | 82.1 /100 | #125 | Excellent 6.5% |
| Brazilians | 81.9 /100 | #126 | Excellent 6.5% |
| Dutch | 80.6 /100 | #127 | Excellent 6.5% |