Immigrants from Zaire vs Marshallese Unemployment Among Ages 55 to 59 years

COMPARE

Immigrants from Zaire
Race
Ancestry
AfghanAfricanAlaska NativeAlaskan AthabascanAlbanianAleutAlsatianAmericanApacheArabArapahoArgentineanArmenianAssyrian/Chaldean/SyriacAustralianAustrianBahamianBangladeshiBarbadianBasqueBelgianBelizeanBermudanBhutaneseBlackfeetBolivianBrazilianBritishBritish West IndianBulgarianBurmeseCajunCambodianCanadianCape VerdeanCarpatho RusynCelticCentral AmericanCentral American IndianCherokeeCheyenneChickasawChileanChineseChippewaChoctawColombianColvilleComancheCosta RicanCreeCreekCroatianCrowCubanCypriotCzechCzechoslovakianDanishDelawareDominicanDutchDutch West IndianEastern EuropeanEcuadorianEgyptianEnglishEstonianEthiopianEuropeanFijianFilipinoFinnishFrenchFrench American IndianFrench CanadianGermanGerman RussianGhanaianGreekGuamanian/ChamorroGuatemalanGuyaneseHaitianHmongHonduranHopiHoumaHungarianIcelanderIndian (Asian)IndonesianInupiatIranianIraqiIrishIroquoisIsraeliItalianJamaicanJapaneseJordanianKenyanKiowaKoreanLaotianLatvianLebaneseLiberianLithuanianLumbeeLuxembourgerMacedonianMalaysianMalteseMenomineeMexicanMexican American IndianMongolianMoroccanNative HawaiianNavajoNepaleseNew ZealanderNicaraguanNigerianNorthern EuropeanNorwegianOkinawanOsageOttawaPaiutePakistaniPalestinianPanamanianParaguayanPennsylvania GermanPeruvianPimaPolishPortuguesePotawatomiPuebloPuerto RicanPuget Sound SalishRomanianRussianSalvadoranSamoanScandinavianScotch-IrishScottishSeminoleSenegaleseSerbianShoshoneSierra LeoneanSiouxSlavicSlovakSloveneSomaliSouth AfricanSouth AmericanSouth American IndianSoviet UnionSpaniardSpanishSpanish AmericanSpanish American IndianSri LankanSubsaharan AfricanSudaneseSwedishSwissSyrianTaiwaneseThaiTlingit-HaidaTohono O'OdhamTonganTrinidadian and TobagonianTsimshianTurkishU.S. Virgin IslanderUgandanUkrainianUruguayanUteVenezuelanVietnameseWelshWest IndianYakamaYaquiYugoslavianYumanYup'ikZimbabwean
Immigration
NonimmigrantsImmigrantsAfghanistanAfricaAlbaniaArgentinaArmeniaAsiaAustraliaAustriaBahamasBangladeshBarbadosBelarusBelgiumBelizeBoliviaBosnia and HerzegovinaBrazilBulgariaBurma/MyanmarCabo VerdeCambodiaCameroonCanadaCaribbeanCentral AmericaChileChinaColombiaCongoCosta RicaCroatiaCubaCzechoslovakiaDenmarkDominicaDominican RepublicEastern AfricaEastern AsiaEastern EuropeEcuadorEgyptEl SalvadorEnglandEritreaEthiopiaEuropeFijiFranceGermanyGhanaGreeceGrenadaGuatemalaGuyanaHaitiHondurasHong KongHungaryIndiaIndonesiaIranIraqIrelandIsraelItalyJamaicaJapanJordanKazakhstanKenyaKoreaKuwaitLaosLatin AmericaLatviaLebanonLiberiaLithuaniaMalaysiaMexicoMicronesiaMiddle AfricaMoldovaMoroccoNepalNetherlandsNicaraguaNigeriaNorth AmericaNorth MacedoniaNorthern AfricaNorthern EuropeNorwayOceaniaPakistanPanamaPeruPhilippinesPolandPortugalRomaniaRussiaSaudi ArabiaScotlandSenegalSerbiaSierra LeoneSingaporeSomaliaSouth AfricaSouth AmericaSouth Central AsiaSouth Eastern AsiaSouthern EuropeSpainSri LankaSt. Vincent and the GrenadinesSudanSwedenSwitzerlandSyriaTaiwanThailandTrinidad and TobagoTurkeyUgandaUkraineUruguayUzbekistanVenezuelaVietnamWest IndiesWestern AfricaWestern AsiaWestern EuropeYemenZaireZimbabweAzores
Marshallese
Race
Ancestry
AfghanAfricanAlaska NativeAlaskan AthabascanAlbanianAleutAlsatianAmericanApacheArabArapahoArgentineanArmenianAssyrian/Chaldean/SyriacAustralianAustrianBahamianBangladeshiBarbadianBasqueBelgianBelizeanBermudanBhutaneseBlackfeetBolivianBrazilianBritishBritish West IndianBulgarianBurmeseCajunCambodianCanadianCape VerdeanCarpatho RusynCelticCentral AmericanCentral American IndianCherokeeCheyenneChickasawChileanChineseChippewaChoctawColombianColvilleComancheCosta RicanCreeCreekCroatianCrowCubanCypriotCzechCzechoslovakianDanishDelawareDominicanDutchDutch West IndianEastern EuropeanEcuadorianEgyptianEnglishEstonianEthiopianEuropeanFijianFilipinoFinnishFrenchFrench American IndianFrench CanadianGermanGerman RussianGhanaianGreekGuamanian/ChamorroGuatemalanGuyaneseHaitianHmongHonduranHopiHoumaHungarianIcelanderIndian (Asian)IndonesianInupiatIranianIraqiIrishIroquoisIsraeliItalianJamaicanJapaneseJordanianKenyanKiowaKoreanLaotianLatvianLebaneseLiberianLithuanianLumbeeLuxembourgerMacedonianMalaysianMalteseMarshalleseMenomineeMexicanMexican American IndianMongolianMoroccanNative HawaiianNavajoNepaleseNew ZealanderNicaraguanNigerianNorthern EuropeanNorwegianOkinawanOsageOttawaPaiutePakistaniPalestinianPanamanianParaguayanPennsylvania GermanPeruvianPimaPolishPortuguesePotawatomiPuebloPuerto RicanPuget Sound SalishRomanianRussianSalvadoranSamoanScandinavianScotch-IrishScottishSeminoleSenegaleseSerbianShoshoneSierra LeoneanSiouxSlavicSlovakSloveneSomaliSouth AfricanSouth AmericanSouth American IndianSoviet UnionSpaniardSpanishSpanish AmericanSpanish American IndianSri LankanSubsaharan AfricanSudaneseSwedishSwissSyrianTaiwaneseThaiTlingit-HaidaTohono O'OdhamTonganTrinidadian and TobagonianTsimshianTurkishU.S. Virgin IslanderUgandanUkrainianUruguayanUteVenezuelanVietnameseWelshWest IndianYakamaYaquiYugoslavianYumanYup'ikZimbabwean
Immigration
NonimmigrantsImmigrantsAfghanistanAfricaAlbaniaArgentinaArmeniaAsiaAustraliaAustriaBahamasBangladeshBarbadosBelarusBelgiumBelizeBoliviaBosnia and HerzegovinaBrazilBulgariaBurma/MyanmarCabo VerdeCambodiaCameroonCanadaCaribbeanCentral AmericaChileChinaColombiaCongoCosta RicaCroatiaCubaCzechoslovakiaDenmarkDominicaDominican RepublicEastern AfricaEastern AsiaEastern EuropeEcuadorEgyptEl SalvadorEnglandEritreaEthiopiaEuropeFijiFranceGermanyGhanaGreeceGrenadaGuatemalaGuyanaHaitiHondurasHong KongHungaryIndiaIndonesiaIranIraqIrelandIsraelItalyJamaicaJapanJordanKazakhstanKenyaKoreaKuwaitLaosLatin AmericaLatviaLebanonLiberiaLithuaniaMalaysiaMexicoMicronesiaMiddle AfricaMoldovaMoroccoNepalNetherlandsNicaraguaNigeriaNorth AmericaNorth MacedoniaNorthern AfricaNorthern EuropeNorwayOceaniaPakistanPanamaPeruPhilippinesPolandPortugalRomaniaRussiaSaudi ArabiaScotlandSenegalSerbiaSierra LeoneSingaporeSomaliaSouth AfricaSouth AmericaSouth Central AsiaSouth Eastern AsiaSouthern EuropeSpainSri LankaSt. Vincent and the GrenadinesSudanSwedenSwitzerlandSyriaTaiwanThailandTrinidad and TobagoTurkeyUgandaUkraineUruguayUzbekistanVenezuelaVietnamWest IndiesWestern AfricaWestern AsiaWestern EuropeYemenZimbabweAzores
Unemployment Among Ages 55 to 59 years
Income
Poverty
Unemployment
Labor Participation
Family Structure
Vehicle Availability
Education Level
Disability

Unemployment Among Ages 55 to 59 years Comparison

Immigrants from Zaire

Marshallese

Exceptional
Tragic
4.5%
UNEMPLOYMENT AMONG AGES 55 TO 59 YEARS
99.8/ 100
METRIC RATING
46th/ 347
METRIC RANK
5.5%
UNEMPLOYMENT AMONG AGES 55 TO 59 YEARS
0.0/ 100
METRIC RATING
303rd/ 347
METRIC RANK

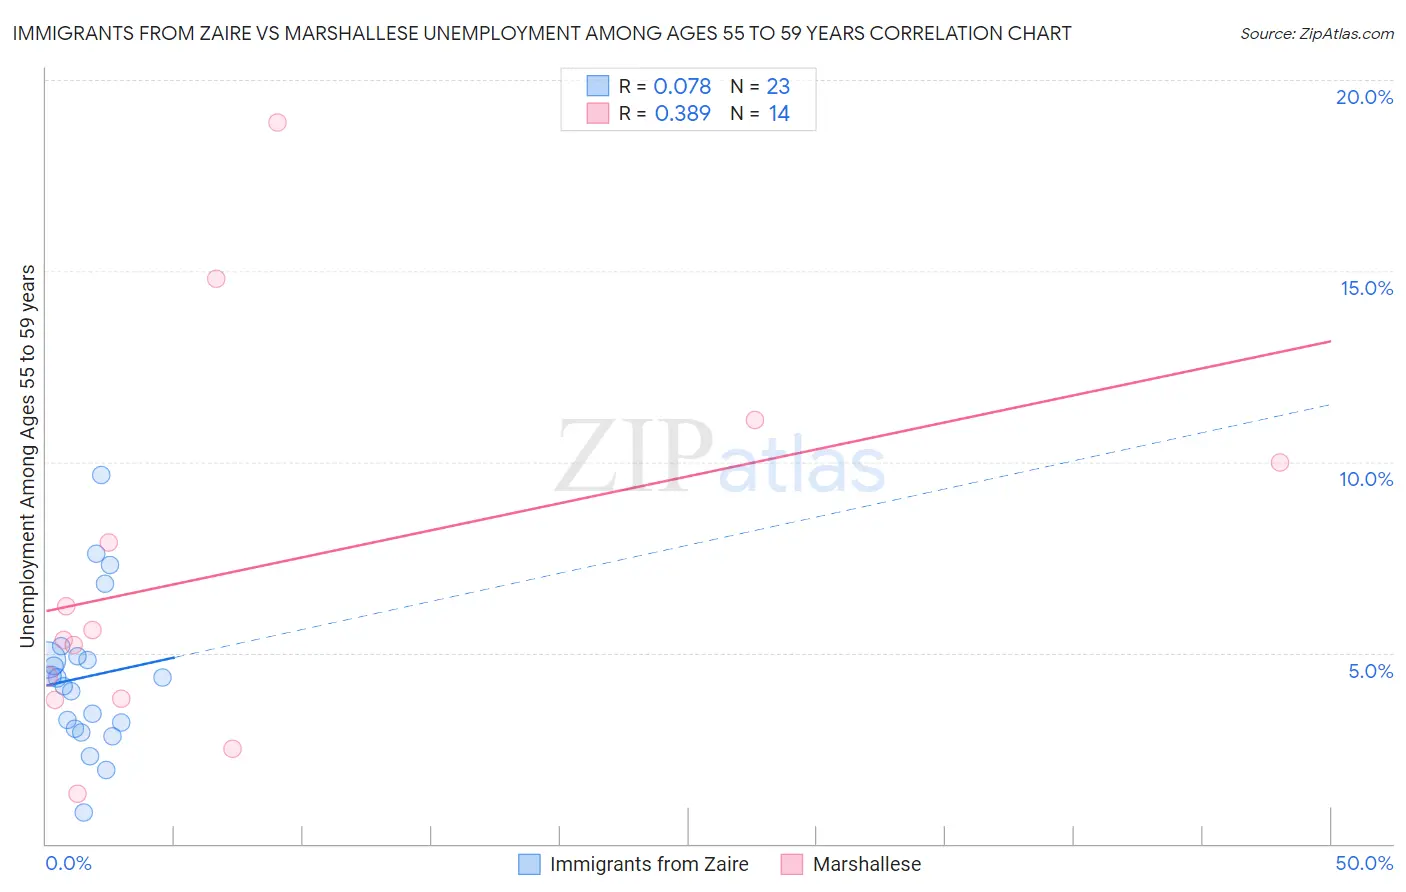
Immigrants from Zaire vs Marshallese Unemployment Among Ages 55 to 59 years Correlation Chart

The statistical analysis conducted on geographies consisting of 104,895,493 people shows a slight positive correlation between the proportion of Immigrants from Zaire and unemployment rate among population between the ages 55 and 59 in the United States with a correlation coefficient (R) of 0.078 and weighted average of 4.5%. Similarly, the statistical analysis conducted on geographies consisting of 14,434,546 people shows a mild positive correlation between the proportion of Marshallese and unemployment rate among population between the ages 55 and 59 in the United States with a correlation coefficient (R) of 0.389 and weighted average of 5.5%, a difference of 21.1%.
Immigrants from Zaire vs Marshallese Unemployment Among Ages 55 to 59 years

Unemployment Among Ages 55 to 59 years Correlation Summary

MeasurementImmigrants from ZaireMarshallese
Minimum0.81%1.3%
Maximum9.6%18.9%
Range8.8%17.6%
Mean4.4%7.2%
Median4.4%5.5%
Interquartile 25% (IQ1)3.0%3.8%
Interquartile 75% (IQ3)4.9%10.0%
Interquartile Range (IQR)1.9%6.2%
Standard Deviation (Sample)2.0%4.9%
Standard Deviation (Population)1.9%4.8%

Similar Demographics by Unemployment Among Ages 55 to 59 years

Demographics Similar to Immigrants from Zaire by Unemployment Among Ages 55 to 59 years

In terms of unemployment among ages 55 to 59 years, the demographic groups most similar to Immigrants from Zaire are British (4.5%, a difference of 0.020%), German Russian (4.5%, a difference of 0.060%), Immigrants from Korea (4.5%, a difference of 0.090%), European (4.5%, a difference of 0.090%), and Immigrants from Kuwait (4.5%, a difference of 0.13%).
DemographicsRating | RankUnemployment Among Ages 55 to 59 years
English
99.9
/100
|
#39
Exceptional
4.5%
Swiss
99.8
/100
|
#40
Exceptional
4.5%
Luxembourgers
99.8
/100
|
#41
Exceptional
4.5%
Immigrants | Kuwait
99.8
/100
|
#42
Exceptional
4.5%
Immigrants | Korea
99.8
/100
|
#43
Exceptional
4.5%
Europeans
99.8
/100
|
#44
Exceptional
4.5%
British
99.8
/100
|
#45
Exceptional
4.5%
Immigrants | Zaire
99.8
/100
|
#46
Exceptional
4.5%
German Russians
99.8
/100
|
#47
Exceptional
4.5%
Immigrants | Moldova
99.7
/100
|
#48
Exceptional
4.5%
Immigrants | Saudi Arabia
99.7
/100
|
#49
Exceptional
4.5%
Immigrants | Pakistan
99.7
/100
|
#50
Exceptional
4.5%
Maltese
99.7
/100
|
#51
Exceptional
4.5%
Scottish
99.7
/100
|
#52
Exceptional
4.5%
Immigrants | Middle Africa
99.7
/100
|
#53
Exceptional
4.5%

Demographics Similar to Marshallese by Unemployment Among Ages 55 to 59 years

In terms of unemployment among ages 55 to 59 years, the demographic groups most similar to Marshallese are Sierra Leonean (5.5%, a difference of 0.010%), Immigrants from Dominica (5.5%, a difference of 0.41%), Black/African American (5.5%, a difference of 0.52%), Immigrants from St. Vincent and the Grenadines (5.4%, a difference of 0.65%), and Immigrants from Portugal (5.5%, a difference of 0.70%).
DemographicsRating | RankUnemployment Among Ages 55 to 59 years
Barbadians
0.0
/100
|
#296
Tragic
5.3%
Immigrants | Mexico
0.0
/100
|
#297
Tragic
5.3%
Hispanics or Latinos
0.0
/100
|
#298
Tragic
5.4%
Cape Verdeans
0.0
/100
|
#299
Tragic
5.4%
Immigrants | St. Vincent and the Grenadines
0.0
/100
|
#300
Tragic
5.4%
Immigrants | Dominica
0.0
/100
|
#301
Tragic
5.5%
Sierra Leoneans
0.0
/100
|
#302
Tragic
5.5%
Marshallese
0.0
/100
|
#303
Tragic
5.5%
Blacks/African Americans
0.0
/100
|
#304
Tragic
5.5%
Immigrants | Portugal
0.0
/100
|
#305
Tragic
5.5%
Immigrants | Cabo Verde
0.0
/100
|
#306
Tragic
5.5%
Immigrants | Belize
0.0
/100
|
#307
Tragic
5.5%
Spanish American Indians
0.0
/100
|
#308
Tragic
5.6%
Nepalese
0.0
/100
|
#309
Tragic
5.6%
Belizeans
0.0
/100
|
#310
Tragic
5.6%