Immigrants from Zaire vs Immigrants from Hungary Unemployment Among Ages 16 to 19 years

COMPARE

Immigrants from Zaire
Race
Ancestry
AfghanAfricanAlaska NativeAlaskan AthabascanAlbanianAleutAlsatianAmericanApacheArabArapahoArgentineanArmenianAssyrian/Chaldean/SyriacAustralianAustrianBahamianBangladeshiBarbadianBasqueBelgianBelizeanBermudanBhutaneseBlackfeetBolivianBrazilianBritishBritish West IndianBulgarianBurmeseCajunCambodianCanadianCape VerdeanCarpatho RusynCelticCentral AmericanCentral American IndianCherokeeCheyenneChickasawChileanChineseChippewaChoctawColombianColvilleComancheCosta RicanCreeCreekCroatianCrowCubanCypriotCzechCzechoslovakianDanishDelawareDominicanDutchDutch West IndianEastern EuropeanEcuadorianEgyptianEnglishEstonianEthiopianEuropeanFijianFilipinoFinnishFrenchFrench American IndianFrench CanadianGermanGerman RussianGhanaianGreekGuamanian/ChamorroGuatemalanGuyaneseHaitianHmongHonduranHopiHoumaHungarianIcelanderIndian (Asian)IndonesianInupiatIranianIraqiIrishIroquoisIsraeliItalianJamaicanJapaneseJordanianKenyanKiowaKoreanLaotianLatvianLebaneseLiberianLithuanianLumbeeLuxembourgerMacedonianMalaysianMalteseMarshalleseMenomineeMexicanMexican American IndianMongolianMoroccanNative HawaiianNavajoNepaleseNew ZealanderNicaraguanNigerianNorthern EuropeanNorwegianOkinawanOsageOttawaPaiutePakistaniPalestinianPanamanianParaguayanPennsylvania GermanPeruvianPimaPolishPortuguesePotawatomiPuebloPuerto RicanPuget Sound SalishRomanianRussianSalvadoranSamoanScandinavianScotch-IrishScottishSeminoleSenegaleseSerbianShoshoneSierra LeoneanSiouxSlavicSlovakSloveneSomaliSouth AfricanSouth AmericanSouth American IndianSoviet UnionSpaniardSpanishSpanish AmericanSpanish American IndianSri LankanSubsaharan AfricanSudaneseSwedishSwissSyrianTaiwaneseThaiTlingit-HaidaTohono O'OdhamTonganTrinidadian and TobagonianTsimshianTurkishU.S. Virgin IslanderUgandanUkrainianUruguayanUteVenezuelanVietnameseWelshWest IndianYakamaYaquiYugoslavianYumanYup'ikZimbabwean
Immigration
NonimmigrantsImmigrantsAfghanistanAfricaAlbaniaArgentinaArmeniaAsiaAustraliaAustriaBahamasBangladeshBarbadosBelarusBelgiumBelizeBoliviaBosnia and HerzegovinaBrazilBulgariaBurma/MyanmarCabo VerdeCambodiaCameroonCanadaCaribbeanCentral AmericaChileChinaColombiaCongoCosta RicaCroatiaCubaCzechoslovakiaDenmarkDominicaDominican RepublicEastern AfricaEastern AsiaEastern EuropeEcuadorEgyptEl SalvadorEnglandEritreaEthiopiaEuropeFijiFranceGermanyGhanaGreeceGrenadaGuatemalaGuyanaHaitiHondurasHong KongIndiaIndonesiaIranIraqIrelandIsraelItalyJamaicaJapanJordanKazakhstanKenyaKoreaKuwaitLaosLatin AmericaLatviaLebanonLiberiaLithuaniaMalaysiaMexicoMicronesiaMiddle AfricaMoldovaMoroccoNepalNetherlandsNicaraguaNigeriaNorth AmericaNorth MacedoniaNorthern AfricaNorthern EuropeNorwayOceaniaPakistanPanamaPeruPhilippinesPolandPortugalRomaniaRussiaSaudi ArabiaScotlandSenegalSerbiaSierra LeoneSingaporeSomaliaSouth AfricaSouth AmericaSouth Central AsiaSouth Eastern AsiaSouthern EuropeSpainSri LankaSt. Vincent and the GrenadinesSudanSwedenSwitzerlandSyriaTaiwanThailandTrinidad and TobagoTurkeyUgandaUkraineUruguayUzbekistanVenezuelaVietnamWest IndiesWestern AfricaWestern AsiaWestern EuropeYemenZaireZimbabweAzores
Immigrants from Hungary
Race
Ancestry
AfghanAfricanAlaska NativeAlaskan AthabascanAlbanianAleutAlsatianAmericanApacheArabArapahoArgentineanArmenianAssyrian/Chaldean/SyriacAustralianAustrianBahamianBangladeshiBarbadianBasqueBelgianBelizeanBermudanBhutaneseBlackfeetBolivianBrazilianBritishBritish West IndianBulgarianBurmeseCajunCambodianCanadianCape VerdeanCarpatho RusynCelticCentral AmericanCentral American IndianCherokeeCheyenneChickasawChileanChineseChippewaChoctawColombianColvilleComancheCosta RicanCreeCreekCroatianCrowCubanCypriotCzechCzechoslovakianDanishDelawareDominicanDutchDutch West IndianEastern EuropeanEcuadorianEgyptianEnglishEstonianEthiopianEuropeanFijianFilipinoFinnishFrenchFrench American IndianFrench CanadianGermanGerman RussianGhanaianGreekGuamanian/ChamorroGuatemalanGuyaneseHaitianHmongHonduranHopiHoumaHungarianIcelanderIndian (Asian)IndonesianInupiatIranianIraqiIrishIroquoisIsraeliItalianJamaicanJapaneseJordanianKenyanKiowaKoreanLaotianLatvianLebaneseLiberianLithuanianLumbeeLuxembourgerMacedonianMalaysianMalteseMarshalleseMenomineeMexicanMexican American IndianMongolianMoroccanNative HawaiianNavajoNepaleseNew ZealanderNicaraguanNigerianNorthern EuropeanNorwegianOkinawanOsageOttawaPaiutePakistaniPalestinianPanamanianParaguayanPennsylvania GermanPeruvianPimaPolishPortuguesePotawatomiPuebloPuerto RicanPuget Sound SalishRomanianRussianSalvadoranSamoanScandinavianScotch-IrishScottishSeminoleSenegaleseSerbianShoshoneSierra LeoneanSiouxSlavicSlovakSloveneSomaliSouth AfricanSouth AmericanSouth American IndianSoviet UnionSpaniardSpanishSpanish AmericanSpanish American IndianSri LankanSubsaharan AfricanSudaneseSwedishSwissSyrianTaiwaneseThaiTlingit-HaidaTohono O'OdhamTonganTrinidadian and TobagonianTsimshianTurkishU.S. Virgin IslanderUgandanUkrainianUruguayanUteVenezuelanVietnameseWelshWest IndianYakamaYaquiYugoslavianYumanYup'ikZimbabwean
Immigration
NonimmigrantsImmigrantsAfghanistanAfricaAlbaniaArgentinaArmeniaAsiaAustraliaAustriaBahamasBangladeshBarbadosBelarusBelgiumBelizeBoliviaBosnia and HerzegovinaBrazilBulgariaBurma/MyanmarCabo VerdeCambodiaCameroonCanadaCaribbeanCentral AmericaChileChinaColombiaCongoCosta RicaCroatiaCubaCzechoslovakiaDenmarkDominicaDominican RepublicEastern AfricaEastern AsiaEastern EuropeEcuadorEgyptEl SalvadorEnglandEritreaEthiopiaEuropeFijiFranceGermanyGhanaGreeceGrenadaGuatemalaGuyanaHaitiHondurasHong KongHungaryIndiaIndonesiaIranIraqIrelandIsraelItalyJamaicaJapanJordanKazakhstanKenyaKoreaKuwaitLaosLatin AmericaLatviaLebanonLiberiaLithuaniaMalaysiaMexicoMicronesiaMiddle AfricaMoldovaMoroccoNepalNetherlandsNicaraguaNigeriaNorth AmericaNorth MacedoniaNorthern AfricaNorthern EuropeNorwayOceaniaPakistanPanamaPeruPhilippinesPolandPortugalRomaniaRussiaSaudi ArabiaScotlandSenegalSerbiaSierra LeoneSingaporeSomaliaSouth AfricaSouth AmericaSouth Central AsiaSouth Eastern AsiaSouthern EuropeSpainSri LankaSt. Vincent and the GrenadinesSudanSwedenSwitzerlandSyriaTaiwanThailandTrinidad and TobagoTurkeyUgandaUkraineUruguayUzbekistanVenezuelaVietnamWest IndiesWestern AfricaWestern AsiaWestern EuropeYemenZimbabweAzores
Unemployment Among Ages 16 to 19 years
Income
Poverty
Unemployment
Labor Participation
Family Structure
Vehicle Availability
Education Level
Disability

Unemployment Among Ages 16 to 19 years Comparison

Immigrants from Zaire

Immigrants from Hungary

Exceptional
Average
15.6%
UNEMPLOYMENT AMONG AGES 16 TO 19 YEARS
100.0/ 100
METRIC RATING
14th/ 347
METRIC RANK
17.5%
UNEMPLOYMENT AMONG AGES 16 TO 19 YEARS
54.7/ 100
METRIC RATING
168th/ 347
METRIC RANK

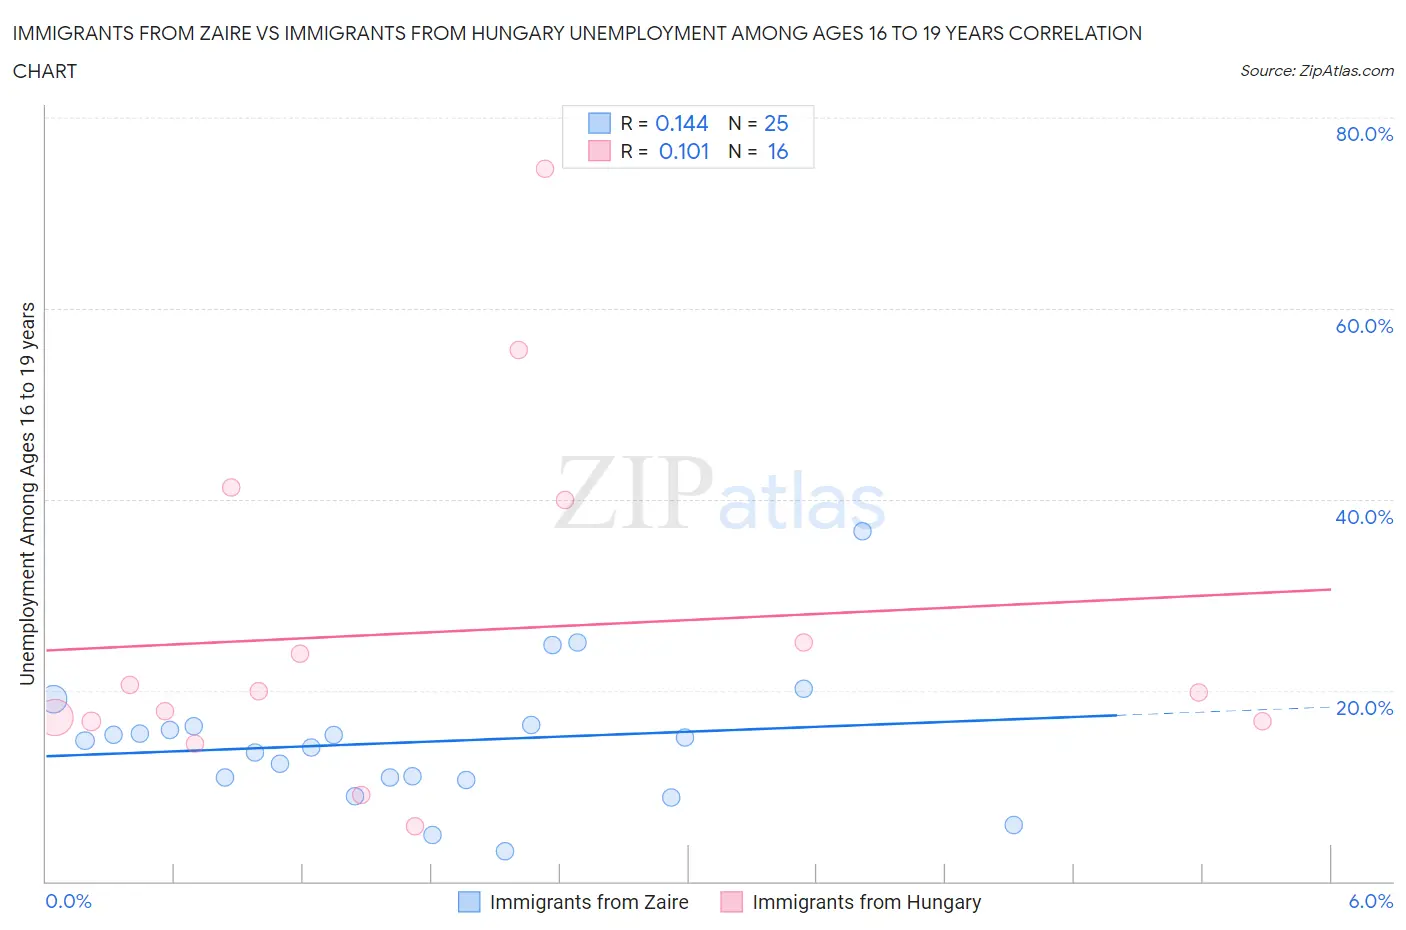
Immigrants from Zaire vs Immigrants from Hungary Unemployment Among Ages 16 to 19 years Correlation Chart

The statistical analysis conducted on geographies consisting of 106,126,404 people shows a poor positive correlation between the proportion of Immigrants from Zaire and unemployment rate among population between the ages 16 and 19 in the United States with a correlation coefficient (R) of 0.144 and weighted average of 15.6%. Similarly, the statistical analysis conducted on geographies consisting of 188,748,138 people shows a poor positive correlation between the proportion of Immigrants from Hungary and unemployment rate among population between the ages 16 and 19 in the United States with a correlation coefficient (R) of 0.101 and weighted average of 17.5%, a difference of 12.3%.
Immigrants from Zaire vs Immigrants from Hungary Unemployment Among Ages 16 to 19 years

Unemployment Among Ages 16 to 19 years Correlation Summary

MeasurementImmigrants from ZaireImmigrants from Hungary
Minimum3.1%5.8%
Maximum36.7%74.6%
Range33.6%68.8%
Mean14.6%26.1%
Median14.7%19.9%
Interquartile 25% (IQ1)10.7%16.8%
Interquartile 75% (IQ3)16.3%32.5%
Interquartile Range (IQR)5.6%15.7%
Standard Deviation (Sample)7.1%18.1%
Standard Deviation (Population)6.9%17.6%

Similar Demographics by Unemployment Among Ages 16 to 19 years

Demographics Similar to Immigrants from Zaire by Unemployment Among Ages 16 to 19 years

In terms of unemployment among ages 16 to 19 years, the demographic groups most similar to Immigrants from Zaire are Yugoslavian (15.6%, a difference of 0.050%), Immigrants from Burma/Myanmar (15.6%, a difference of 0.14%), German (15.7%, a difference of 0.34%), Somali (15.7%, a difference of 0.55%), and Taiwanese (15.5%, a difference of 0.58%).
DemographicsRating | RankUnemployment Among Ages 16 to 19 years
Immigrants | Bosnia and Herzegovina
100.0
/100
|
#7
Exceptional
15.3%
Czechs
100.0
/100
|
#8
Exceptional
15.4%
Scandinavians
100.0
/100
|
#9
Exceptional
15.4%
Zimbabweans
100.0
/100
|
#10
Exceptional
15.4%
Indonesians
100.0
/100
|
#11
Exceptional
15.5%
Taiwanese
100.0
/100
|
#12
Exceptional
15.5%
Immigrants | Burma/Myanmar
100.0
/100
|
#13
Exceptional
15.6%
Immigrants | Zaire
100.0
/100
|
#14
Exceptional
15.6%
Yugoslavians
100.0
/100
|
#15
Exceptional
15.6%
Germans
100.0
/100
|
#16
Exceptional
15.7%
Somalis
100.0
/100
|
#17
Exceptional
15.7%
Thais
100.0
/100
|
#18
Exceptional
15.7%
Swiss
100.0
/100
|
#19
Exceptional
15.8%
Sudanese
100.0
/100
|
#20
Exceptional
15.8%
Immigrants | Taiwan
100.0
/100
|
#21
Exceptional
15.8%

Demographics Similar to Immigrants from Hungary by Unemployment Among Ages 16 to 19 years

In terms of unemployment among ages 16 to 19 years, the demographic groups most similar to Immigrants from Hungary are Immigrants from France (17.5%, a difference of 0.010%), Immigrants from Cambodia (17.5%, a difference of 0.010%), Immigrants from Italy (17.5%, a difference of 0.020%), Cape Verdean (17.5%, a difference of 0.050%), and Immigrants from Romania (17.5%, a difference of 0.070%).
DemographicsRating | RankUnemployment Among Ages 16 to 19 years
Immigrants | Denmark
60.3
/100
|
#161
Good
17.5%
Immigrants | Norway
59.8
/100
|
#162
Average
17.5%
Egyptians
59.7
/100
|
#163
Average
17.5%
Immigrants | Austria
57.7
/100
|
#164
Average
17.5%
Cape Verdeans
55.8
/100
|
#165
Average
17.5%
Immigrants | Italy
55.2
/100
|
#166
Average
17.5%
Immigrants | France
54.9
/100
|
#167
Average
17.5%
Immigrants | Hungary
54.7
/100
|
#168
Average
17.5%
Immigrants | Cambodia
54.5
/100
|
#169
Average
17.5%
Immigrants | Romania
53.3
/100
|
#170
Average
17.5%
Immigrants | Switzerland
53.2
/100
|
#171
Average
17.5%
Immigrants | Western Europe
52.2
/100
|
#172
Average
17.6%
Chileans
50.8
/100
|
#173
Average
17.6%
Osage
50.0
/100
|
#174
Average
17.6%
Immigrants | Sweden
49.1
/100
|
#175
Average
17.6%