Immigrants from Zaire vs Estonian Unemployment Among Ages 65 to 74 years

COMPARE

Immigrants from Zaire
Race
Ancestry
AfghanAfricanAlaska NativeAlaskan AthabascanAlbanianAleutAlsatianAmericanApacheArabArapahoArgentineanArmenianAssyrian/Chaldean/SyriacAustralianAustrianBahamianBangladeshiBarbadianBasqueBelgianBelizeanBermudanBhutaneseBlackfeetBolivianBrazilianBritishBritish West IndianBulgarianBurmeseCajunCambodianCanadianCape VerdeanCarpatho RusynCelticCentral AmericanCentral American IndianCherokeeCheyenneChickasawChileanChineseChippewaChoctawColombianColvilleComancheCosta RicanCreeCreekCroatianCrowCubanCypriotCzechCzechoslovakianDanishDelawareDominicanDutchDutch West IndianEastern EuropeanEcuadorianEgyptianEnglishEthiopianEuropeanFijianFilipinoFinnishFrenchFrench American IndianFrench CanadianGermanGerman RussianGhanaianGreekGuamanian/ChamorroGuatemalanGuyaneseHaitianHmongHonduranHopiHoumaHungarianIcelanderIndian (Asian)IndonesianInupiatIranianIraqiIrishIroquoisIsraeliItalianJamaicanJapaneseJordanianKenyanKiowaKoreanLaotianLatvianLebaneseLiberianLithuanianLumbeeLuxembourgerMacedonianMalaysianMalteseMarshalleseMenomineeMexicanMexican American IndianMongolianMoroccanNative HawaiianNavajoNepaleseNew ZealanderNicaraguanNigerianNorthern EuropeanNorwegianOkinawanOsageOttawaPaiutePakistaniPalestinianPanamanianParaguayanPennsylvania GermanPeruvianPimaPolishPortuguesePotawatomiPuebloPuerto RicanPuget Sound SalishRomanianRussianSalvadoranSamoanScandinavianScotch-IrishScottishSeminoleSenegaleseSerbianShoshoneSierra LeoneanSiouxSlavicSlovakSloveneSomaliSouth AfricanSouth AmericanSouth American IndianSoviet UnionSpaniardSpanishSpanish AmericanSpanish American IndianSri LankanSubsaharan AfricanSudaneseSwedishSwissSyrianTaiwaneseThaiTlingit-HaidaTohono O'OdhamTonganTrinidadian and TobagonianTsimshianTurkishU.S. Virgin IslanderUgandanUkrainianUruguayanUteVenezuelanVietnameseWelshWest IndianYakamaYaquiYugoslavianYumanYup'ikZimbabwean
Immigration
NonimmigrantsImmigrantsAfghanistanAfricaAlbaniaArgentinaArmeniaAsiaAustraliaAustriaBahamasBangladeshBarbadosBelarusBelgiumBelizeBoliviaBosnia and HerzegovinaBrazilBulgariaBurma/MyanmarCabo VerdeCambodiaCameroonCanadaCaribbeanCentral AmericaChileChinaColombiaCongoCosta RicaCroatiaCubaCzechoslovakiaDenmarkDominicaDominican RepublicEastern AfricaEastern AsiaEastern EuropeEcuadorEgyptEl SalvadorEnglandEritreaEthiopiaEuropeFijiFranceGermanyGhanaGreeceGrenadaGuatemalaGuyanaHaitiHondurasHong KongHungaryIndiaIndonesiaIranIraqIrelandIsraelItalyJamaicaJapanJordanKazakhstanKenyaKoreaKuwaitLaosLatin AmericaLatviaLebanonLiberiaLithuaniaMalaysiaMexicoMicronesiaMiddle AfricaMoldovaMoroccoNepalNetherlandsNicaraguaNigeriaNorth AmericaNorth MacedoniaNorthern AfricaNorthern EuropeNorwayOceaniaPakistanPanamaPeruPhilippinesPolandPortugalRomaniaRussiaSaudi ArabiaScotlandSenegalSerbiaSierra LeoneSingaporeSomaliaSouth AfricaSouth AmericaSouth Central AsiaSouth Eastern AsiaSouthern EuropeSpainSri LankaSt. Vincent and the GrenadinesSudanSwedenSwitzerlandSyriaTaiwanThailandTrinidad and TobagoTurkeyUgandaUkraineUruguayUzbekistanVenezuelaVietnamWest IndiesWestern AfricaWestern AsiaWestern EuropeYemenZaireZimbabweAzores
Estonian
Race
Ancestry
AfghanAfricanAlaska NativeAlaskan AthabascanAlbanianAleutAlsatianAmericanApacheArabArapahoArgentineanArmenianAssyrian/Chaldean/SyriacAustralianAustrianBahamianBangladeshiBarbadianBasqueBelgianBelizeanBermudanBhutaneseBlackfeetBolivianBrazilianBritishBritish West IndianBulgarianBurmeseCajunCambodianCanadianCape VerdeanCarpatho RusynCelticCentral AmericanCentral American IndianCherokeeCheyenneChickasawChileanChineseChippewaChoctawColombianColvilleComancheCosta RicanCreeCreekCroatianCrowCubanCypriotCzechCzechoslovakianDanishDelawareDominicanDutchDutch West IndianEastern EuropeanEcuadorianEgyptianEnglishEstonianEthiopianEuropeanFijianFilipinoFinnishFrenchFrench American IndianFrench CanadianGermanGerman RussianGhanaianGreekGuamanian/ChamorroGuatemalanGuyaneseHaitianHmongHonduranHopiHoumaHungarianIcelanderIndian (Asian)IndonesianInupiatIranianIraqiIrishIroquoisIsraeliItalianJamaicanJapaneseJordanianKenyanKiowaKoreanLaotianLatvianLebaneseLiberianLithuanianLumbeeLuxembourgerMacedonianMalaysianMalteseMarshalleseMenomineeMexicanMexican American IndianMongolianMoroccanNative HawaiianNavajoNepaleseNew ZealanderNicaraguanNigerianNorthern EuropeanNorwegianOkinawanOsageOttawaPaiutePakistaniPalestinianPanamanianParaguayanPennsylvania GermanPeruvianPimaPolishPortuguesePotawatomiPuebloPuerto RicanPuget Sound SalishRomanianRussianSalvadoranSamoanScandinavianScotch-IrishScottishSeminoleSenegaleseSerbianShoshoneSierra LeoneanSiouxSlavicSlovakSloveneSomaliSouth AfricanSouth AmericanSouth American IndianSoviet UnionSpaniardSpanishSpanish AmericanSpanish American IndianSri LankanSubsaharan AfricanSudaneseSwedishSwissSyrianTaiwaneseThaiTlingit-HaidaTohono O'OdhamTonganTrinidadian and TobagonianTsimshianTurkishU.S. Virgin IslanderUgandanUkrainianUruguayanUteVenezuelanVietnameseWelshWest IndianYakamaYaquiYugoslavianYumanYup'ikZimbabwean
Immigration
NonimmigrantsImmigrantsAfghanistanAfricaAlbaniaArgentinaArmeniaAsiaAustraliaAustriaBahamasBangladeshBarbadosBelarusBelgiumBelizeBoliviaBosnia and HerzegovinaBrazilBulgariaBurma/MyanmarCabo VerdeCambodiaCameroonCanadaCaribbeanCentral AmericaChileChinaColombiaCongoCosta RicaCroatiaCubaCzechoslovakiaDenmarkDominicaDominican RepublicEastern AfricaEastern AsiaEastern EuropeEcuadorEgyptEl SalvadorEnglandEritreaEthiopiaEuropeFijiFranceGermanyGhanaGreeceGrenadaGuatemalaGuyanaHaitiHondurasHong KongHungaryIndiaIndonesiaIranIraqIrelandIsraelItalyJamaicaJapanJordanKazakhstanKenyaKoreaKuwaitLaosLatin AmericaLatviaLebanonLiberiaLithuaniaMalaysiaMexicoMicronesiaMiddle AfricaMoldovaMoroccoNepalNetherlandsNicaraguaNigeriaNorth AmericaNorth MacedoniaNorthern AfricaNorthern EuropeNorwayOceaniaPakistanPanamaPeruPhilippinesPolandPortugalRomaniaRussiaSaudi ArabiaScotlandSenegalSerbiaSierra LeoneSingaporeSomaliaSouth AfricaSouth AmericaSouth Central AsiaSouth Eastern AsiaSouthern EuropeSpainSri LankaSt. Vincent and the GrenadinesSudanSwedenSwitzerlandSyriaTaiwanThailandTrinidad and TobagoTurkeyUgandaUkraineUruguayUzbekistanVenezuelaVietnamWest IndiesWestern AfricaWestern AsiaWestern EuropeYemenZimbabweAzores
Unemployment Among Ages 65 to 74 years
Income
Poverty
Unemployment
Labor Participation
Family Structure
Vehicle Availability
Education Level
Disability

Unemployment Among Ages 65 to 74 years Comparison

Immigrants from Zaire

Estonians

Exceptional
Exceptional
4.8%
UNEMPLOYMENT AMONG AGES 65 TO 74 YEARS
100.0/ 100
METRIC RATING
20th/ 347
METRIC RANK
5.2%
UNEMPLOYMENT AMONG AGES 65 TO 74 YEARS
99.0/ 100
METRIC RATING
76th/ 347
METRIC RANK

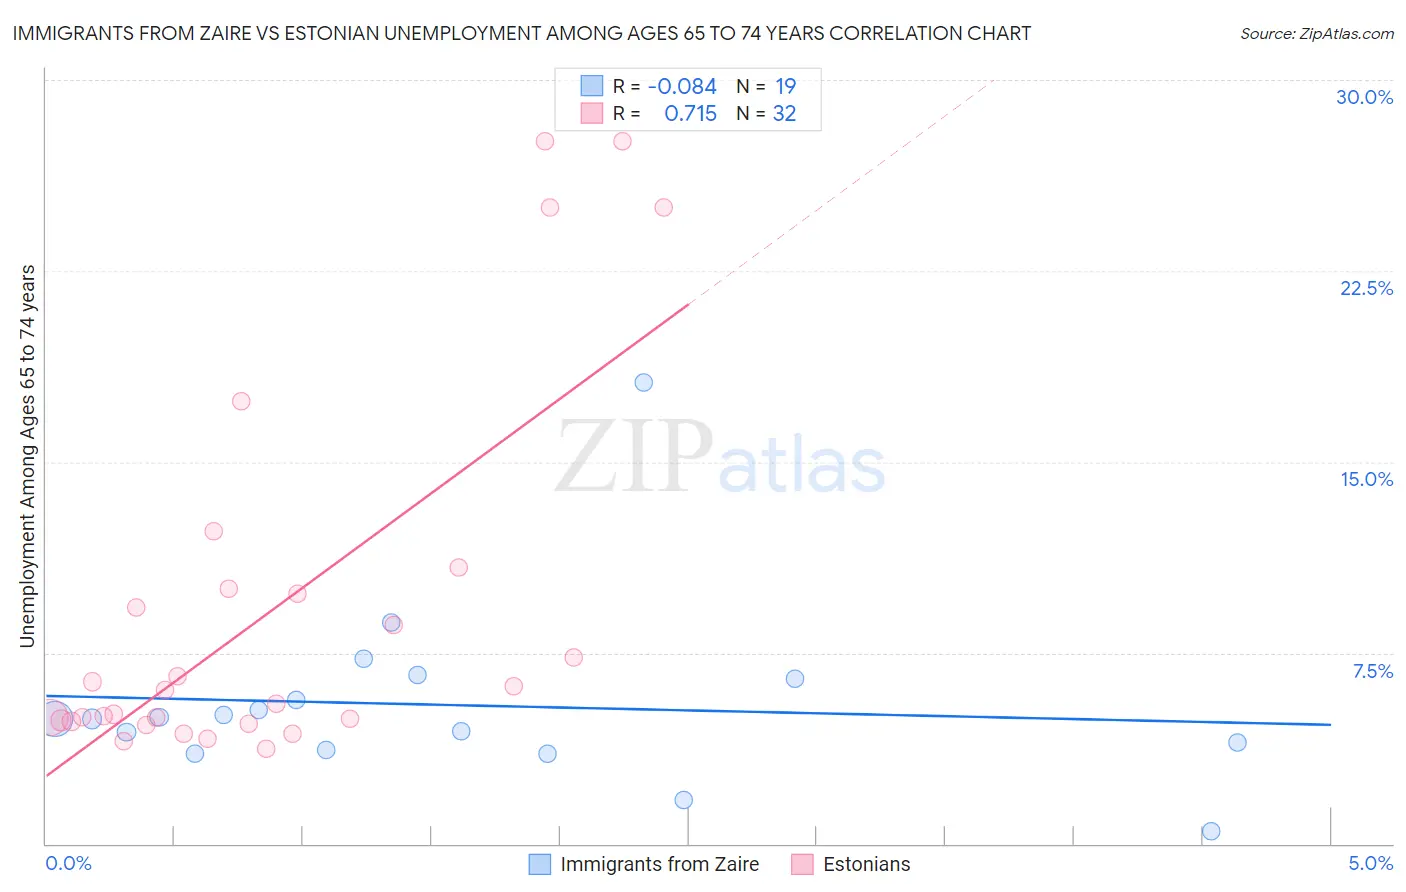
Immigrants from Zaire vs Estonian Unemployment Among Ages 65 to 74 years Correlation Chart

The statistical analysis conducted on geographies consisting of 102,246,015 people shows a slight negative correlation between the proportion of Immigrants from Zaire and unemployment rate among population between the ages 65 and 74 in the United States with a correlation coefficient (R) of -0.084 and weighted average of 4.8%. Similarly, the statistical analysis conducted on geographies consisting of 116,808,577 people shows a strong positive correlation between the proportion of Estonians and unemployment rate among population between the ages 65 and 74 in the United States with a correlation coefficient (R) of 0.715 and weighted average of 5.2%, a difference of 6.7%.
Immigrants from Zaire vs Estonian Unemployment Among Ages 65 to 74 years

Unemployment Among Ages 65 to 74 years Correlation Summary

MeasurementImmigrants from ZaireEstonian
Minimum0.50%3.7%
Maximum18.1%27.6%
Range17.6%23.9%
Mean5.5%9.1%
Median4.9%5.8%
Interquartile 25% (IQ1)3.7%4.8%
Interquartile 75% (IQ3)6.5%9.9%
Interquartile Range (IQR)2.8%5.1%
Standard Deviation (Sample)3.6%7.2%
Standard Deviation (Population)3.5%7.1%

Similar Demographics by Unemployment Among Ages 65 to 74 years

Demographics Similar to Immigrants from Zaire by Unemployment Among Ages 65 to 74 years

In terms of unemployment among ages 65 to 74 years, the demographic groups most similar to Immigrants from Zaire are Menominee (4.8%, a difference of 0.26%), Creek (4.8%, a difference of 0.30%), Kenyan (4.8%, a difference of 0.38%), Immigrants from Eritrea (4.9%, a difference of 0.38%), and Immigrants from Burma/Myanmar (4.8%, a difference of 0.40%).
DemographicsRating | RankUnemployment Among Ages 65 to 74 years
Lumbee
100.0
/100
|
#13
Exceptional
4.8%
Cubans
100.0
/100
|
#14
Exceptional
4.8%
Immigrants | North Macedonia
100.0
/100
|
#15
Exceptional
4.8%
Immigrants | Burma/Myanmar
100.0
/100
|
#16
Exceptional
4.8%
Kenyans
100.0
/100
|
#17
Exceptional
4.8%
Creek
100.0
/100
|
#18
Exceptional
4.8%
Menominee
100.0
/100
|
#19
Exceptional
4.8%
Immigrants | Zaire
100.0
/100
|
#20
Exceptional
4.8%
Immigrants | Eritrea
100.0
/100
|
#21
Exceptional
4.9%
Lebanese
100.0
/100
|
#22
Exceptional
4.9%
Immigrants | Nepal
100.0
/100
|
#23
Exceptional
4.9%
Iraqis
100.0
/100
|
#24
Exceptional
4.9%
Macedonians
100.0
/100
|
#25
Exceptional
5.0%
Czechs
100.0
/100
|
#26
Exceptional
5.0%
Norwegians
100.0
/100
|
#27
Exceptional
5.0%

Demographics Similar to Estonians by Unemployment Among Ages 65 to 74 years

In terms of unemployment among ages 65 to 74 years, the demographic groups most similar to Estonians are Okinawan (5.2%, a difference of 0.0%), Afghan (5.2%, a difference of 0.010%), Immigrants from Sudan (5.2%, a difference of 0.010%), Filipino (5.2%, a difference of 0.020%), and Northern European (5.2%, a difference of 0.020%).
DemographicsRating | RankUnemployment Among Ages 65 to 74 years
Scandinavians
99.1
/100
|
#69
Exceptional
5.2%
Immigrants | Japan
99.1
/100
|
#70
Exceptional
5.2%
Scotch-Irish
99.0
/100
|
#71
Exceptional
5.2%
Immigrants | Oceania
99.0
/100
|
#72
Exceptional
5.2%
Filipinos
99.0
/100
|
#73
Exceptional
5.2%
Afghans
99.0
/100
|
#74
Exceptional
5.2%
Okinawans
99.0
/100
|
#75
Exceptional
5.2%
Estonians
99.0
/100
|
#76
Exceptional
5.2%
Immigrants | Sudan
98.9
/100
|
#77
Exceptional
5.2%
Northern Europeans
98.9
/100
|
#78
Exceptional
5.2%
Slavs
98.7
/100
|
#79
Exceptional
5.2%
Immigrants | South Africa
98.6
/100
|
#80
Exceptional
5.2%
Immigrants | Scotland
98.6
/100
|
#81
Exceptional
5.2%
Thais
98.6
/100
|
#82
Exceptional
5.2%
Immigrants | Middle Africa
98.4
/100
|
#83
Exceptional
5.2%