Immigrants from Yemen vs Vietnamese Unemployment Among Ages 16 to 19 years

COMPARE

Immigrants from Yemen
Race
Ancestry
AfghanAfricanAlaska NativeAlaskan AthabascanAlbanianAleutAlsatianAmericanApacheArabArapahoArgentineanArmenianAssyrian/Chaldean/SyriacAustralianAustrianBahamianBangladeshiBarbadianBasqueBelgianBelizeanBermudanBhutaneseBlackfeetBolivianBrazilianBritishBritish West IndianBulgarianBurmeseCajunCambodianCanadianCape VerdeanCarpatho RusynCelticCentral AmericanCentral American IndianCherokeeCheyenneChickasawChileanChineseChippewaChoctawColombianColvilleComancheCosta RicanCreeCreekCroatianCrowCubanCypriotCzechCzechoslovakianDanishDelawareDominicanDutchDutch West IndianEastern EuropeanEcuadorianEgyptianEnglishEstonianEthiopianEuropeanFijianFilipinoFinnishFrenchFrench American IndianFrench CanadianGermanGerman RussianGhanaianGreekGuamanian/ChamorroGuatemalanGuyaneseHaitianHmongHonduranHopiHoumaHungarianIcelanderIndian (Asian)IndonesianInupiatIranianIraqiIrishIroquoisIsraeliItalianJamaicanJapaneseJordanianKenyanKiowaKoreanLaotianLatvianLebaneseLiberianLithuanianLumbeeLuxembourgerMacedonianMalaysianMalteseMarshalleseMenomineeMexicanMexican American IndianMongolianMoroccanNative HawaiianNavajoNepaleseNew ZealanderNicaraguanNigerianNorthern EuropeanNorwegianOkinawanOsageOttawaPaiutePakistaniPalestinianPanamanianParaguayanPennsylvania GermanPeruvianPimaPolishPortuguesePotawatomiPuebloPuerto RicanPuget Sound SalishRomanianRussianSalvadoranSamoanScandinavianScotch-IrishScottishSeminoleSenegaleseSerbianShoshoneSierra LeoneanSiouxSlavicSlovakSloveneSomaliSouth AfricanSouth AmericanSouth American IndianSoviet UnionSpaniardSpanishSpanish AmericanSpanish American IndianSri LankanSubsaharan AfricanSudaneseSwedishSwissSyrianTaiwaneseThaiTlingit-HaidaTohono O'OdhamTonganTrinidadian and TobagonianTsimshianTurkishU.S. Virgin IslanderUgandanUkrainianUruguayanUteVenezuelanWelshWest IndianYakamaYaquiYugoslavianYumanYup'ikZimbabwean
Immigration
NonimmigrantsImmigrantsAfghanistanAfricaAlbaniaArgentinaArmeniaAsiaAustraliaAustriaBahamasBangladeshBarbadosBelarusBelgiumBelizeBoliviaBosnia and HerzegovinaBrazilBulgariaBurma/MyanmarCabo VerdeCambodiaCameroonCanadaCaribbeanCentral AmericaChileChinaColombiaCongoCosta RicaCroatiaCubaCzechoslovakiaDenmarkDominicaDominican RepublicEastern AfricaEastern AsiaEastern EuropeEcuadorEgyptEl SalvadorEnglandEritreaEthiopiaEuropeFijiFranceGermanyGhanaGreeceGrenadaGuatemalaGuyanaHaitiHondurasHong KongHungaryIndiaIndonesiaIranIraqIrelandIsraelItalyJamaicaJapanJordanKazakhstanKenyaKoreaKuwaitLaosLatin AmericaLatviaLebanonLiberiaLithuaniaMalaysiaMexicoMicronesiaMiddle AfricaMoldovaMoroccoNepalNetherlandsNicaraguaNigeriaNorth AmericaNorth MacedoniaNorthern AfricaNorthern EuropeNorwayOceaniaPakistanPanamaPeruPhilippinesPolandPortugalRomaniaRussiaSaudi ArabiaScotlandSenegalSerbiaSierra LeoneSingaporeSomaliaSouth AfricaSouth AmericaSouth Central AsiaSouth Eastern AsiaSouthern EuropeSpainSri LankaSt. Vincent and the GrenadinesSudanSwedenSwitzerlandSyriaTaiwanThailandTrinidad and TobagoTurkeyUgandaUkraineUruguayUzbekistanVenezuelaVietnamWest IndiesWestern AfricaWestern AsiaWestern EuropeYemenZaireZimbabweAzores
Vietnamese
Race
Ancestry
AfghanAfricanAlaska NativeAlaskan AthabascanAlbanianAleutAlsatianAmericanApacheArabArapahoArgentineanArmenianAssyrian/Chaldean/SyriacAustralianAustrianBahamianBangladeshiBarbadianBasqueBelgianBelizeanBermudanBhutaneseBlackfeetBolivianBrazilianBritishBritish West IndianBulgarianBurmeseCajunCambodianCanadianCape VerdeanCarpatho RusynCelticCentral AmericanCentral American IndianCherokeeCheyenneChickasawChileanChineseChippewaChoctawColombianColvilleComancheCosta RicanCreeCreekCroatianCrowCubanCypriotCzechCzechoslovakianDanishDelawareDominicanDutchDutch West IndianEastern EuropeanEcuadorianEgyptianEnglishEstonianEthiopianEuropeanFijianFilipinoFinnishFrenchFrench American IndianFrench CanadianGermanGerman RussianGhanaianGreekGuamanian/ChamorroGuatemalanGuyaneseHaitianHmongHonduranHopiHoumaHungarianIcelanderIndian (Asian)IndonesianInupiatIranianIraqiIrishIroquoisIsraeliItalianJamaicanJapaneseJordanianKenyanKiowaKoreanLaotianLatvianLebaneseLiberianLithuanianLumbeeLuxembourgerMacedonianMalaysianMalteseMarshalleseMenomineeMexicanMexican American IndianMongolianMoroccanNative HawaiianNavajoNepaleseNew ZealanderNicaraguanNigerianNorthern EuropeanNorwegianOkinawanOsageOttawaPaiutePakistaniPalestinianPanamanianParaguayanPennsylvania GermanPeruvianPimaPolishPortuguesePotawatomiPuebloPuerto RicanPuget Sound SalishRomanianRussianSalvadoranSamoanScandinavianScotch-IrishScottishSeminoleSenegaleseSerbianShoshoneSierra LeoneanSiouxSlavicSlovakSloveneSomaliSouth AfricanSouth AmericanSouth American IndianSoviet UnionSpaniardSpanishSpanish AmericanSpanish American IndianSri LankanSubsaharan AfricanSudaneseSwedishSwissSyrianTaiwaneseThaiTlingit-HaidaTohono O'OdhamTonganTrinidadian and TobagonianTsimshianTurkishU.S. Virgin IslanderUgandanUkrainianUruguayanUteVenezuelanVietnameseWelshWest IndianYakamaYaquiYugoslavianYumanYup'ikZimbabwean
Immigration
NonimmigrantsImmigrantsAfghanistanAfricaAlbaniaArgentinaArmeniaAsiaAustraliaAustriaBahamasBangladeshBarbadosBelarusBelgiumBelizeBoliviaBosnia and HerzegovinaBrazilBulgariaBurma/MyanmarCabo VerdeCambodiaCameroonCanadaCaribbeanCentral AmericaChileChinaColombiaCongoCosta RicaCroatiaCubaCzechoslovakiaDenmarkDominicaDominican RepublicEastern AfricaEastern AsiaEastern EuropeEcuadorEgyptEl SalvadorEnglandEritreaEthiopiaEuropeFijiFranceGermanyGhanaGreeceGrenadaGuatemalaGuyanaHaitiHondurasHong KongHungaryIndiaIndonesiaIranIraqIrelandIsraelItalyJamaicaJapanJordanKazakhstanKenyaKoreaKuwaitLaosLatin AmericaLatviaLebanonLiberiaLithuaniaMalaysiaMexicoMicronesiaMiddle AfricaMoldovaMoroccoNepalNetherlandsNicaraguaNigeriaNorth AmericaNorth MacedoniaNorthern AfricaNorthern EuropeNorwayOceaniaPakistanPanamaPeruPhilippinesPolandPortugalRomaniaRussiaSaudi ArabiaScotlandSenegalSerbiaSierra LeoneSingaporeSomaliaSouth AfricaSouth AmericaSouth Central AsiaSouth Eastern AsiaSouthern EuropeSpainSri LankaSt. Vincent and the GrenadinesSudanSwedenSwitzerlandSyriaTaiwanThailandTrinidad and TobagoTurkeyUgandaUkraineUruguayUzbekistanVenezuelaVietnamWest IndiesWestern AfricaWestern AsiaWestern EuropeZaireZimbabweAzores
Unemployment Among Ages 16 to 19 years
Income
Poverty
Unemployment
Labor Participation
Family Structure
Vehicle Availability
Education Level
Disability

Unemployment Among Ages 16 to 19 years Comparison

Immigrants from Yemen

Vietnamese

Tragic
Tragic
20.0%
UNEMPLOYMENT AMONG AGES 16 TO 19 YEARS
0.0/ 100
METRIC RATING
291st/ 347
METRIC RANK
21.5%
UNEMPLOYMENT AMONG AGES 16 TO 19 YEARS
0.0/ 100
METRIC RATING
310th/ 347
METRIC RANK

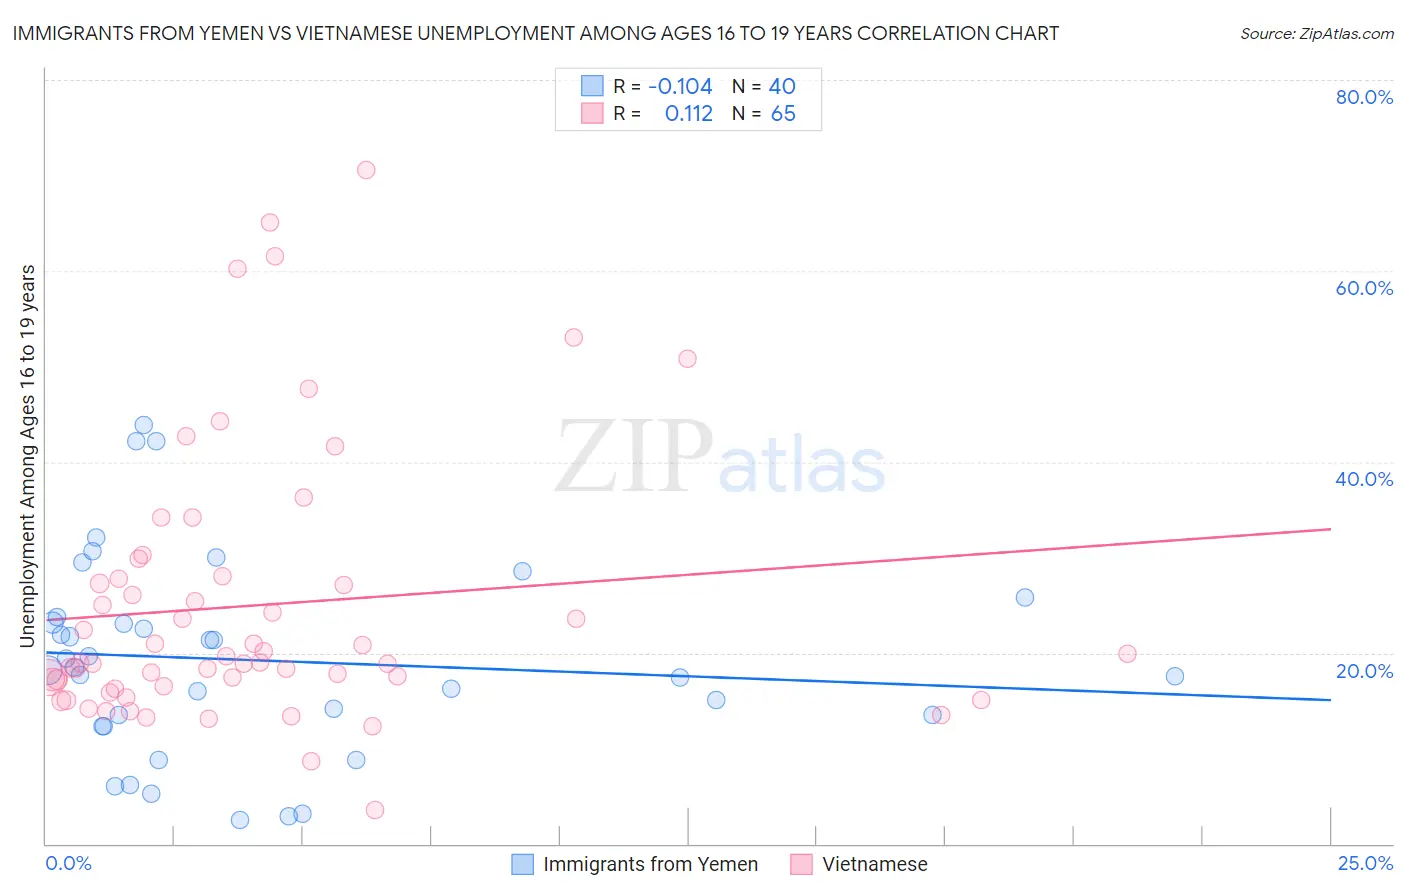
Immigrants from Yemen vs Vietnamese Unemployment Among Ages 16 to 19 years Correlation Chart

The statistical analysis conducted on geographies consisting of 81,680,406 people shows a poor negative correlation between the proportion of Immigrants from Yemen and unemployment rate among population between the ages 16 and 19 in the United States with a correlation coefficient (R) of -0.104 and weighted average of 20.0%. Similarly, the statistical analysis conducted on geographies consisting of 167,034,023 people shows a poor positive correlation between the proportion of Vietnamese and unemployment rate among population between the ages 16 and 19 in the United States with a correlation coefficient (R) of 0.112 and weighted average of 21.5%, a difference of 7.4%.
Immigrants from Yemen vs Vietnamese Unemployment Among Ages 16 to 19 years

Unemployment Among Ages 16 to 19 years Correlation Summary

MeasurementImmigrants from YemenVietnamese
Minimum2.5%3.6%
Maximum43.9%70.6%
Range41.4%67.0%
Mean19.2%25.0%
Median18.3%19.0%
Interquartile 25% (IQ1)12.9%16.4%
Interquartile 75% (IQ3)23.5%27.9%
Interquartile Range (IQR)10.6%11.5%
Standard Deviation (Sample)10.4%14.2%
Standard Deviation (Population)10.2%14.1%

Demographics Similar to Immigrants from Yemen and Vietnamese by Unemployment Among Ages 16 to 19 years

In terms of unemployment among ages 16 to 19 years, the demographic groups most similar to Immigrants from Yemen are Immigrants from Sierra Leone (20.0%, a difference of 0.43%), Comanche (20.2%, a difference of 1.0%), Immigrants from Bahamas (20.4%, a difference of 1.7%), Immigrants from Haiti (20.4%, a difference of 1.9%), and Central American Indian (20.4%, a difference of 2.0%). Similarly, the demographic groups most similar to Vietnamese are Native/Alaskan (21.5%, a difference of 0.060%), Immigrants from Bangladesh (21.5%, a difference of 0.22%), Black/African American (21.4%, a difference of 0.60%), U.S. Virgin Islander (21.3%, a difference of 1.2%), and Immigrants from Senegal (21.2%, a difference of 1.6%).
DemographicsRating | RankUnemployment Among Ages 16 to 19 years
Immigrants | Sierra Leone
0.0
/100
|
#290
Tragic
20.0%
Immigrants | Yemen
0.0
/100
|
#291
Tragic
20.0%
Comanche
0.0
/100
|
#292
Tragic
20.2%
Immigrants | Bahamas
0.0
/100
|
#293
Tragic
20.4%
Immigrants | Haiti
0.0
/100
|
#294
Tragic
20.4%
Central American Indians
0.0
/100
|
#295
Tragic
20.4%
Armenians
0.0
/100
|
#296
Tragic
20.5%
Alsatians
0.0
/100
|
#297
Tragic
20.5%
Haitians
0.0
/100
|
#298
Tragic
20.5%
Immigrants | Uzbekistan
0.0
/100
|
#299
Tragic
20.5%
Ecuadorians
0.0
/100
|
#300
Tragic
20.5%
Immigrants | Ecuador
0.0
/100
|
#301
Tragic
20.9%
Immigrants | Caribbean
0.0
/100
|
#302
Tragic
20.9%
Senegalese
0.0
/100
|
#303
Tragic
21.0%
Aleuts
0.0
/100
|
#304
Tragic
21.2%
Immigrants | Senegal
0.0
/100
|
#305
Tragic
21.2%
U.S. Virgin Islanders
0.0
/100
|
#306
Tragic
21.3%
Blacks/African Americans
0.0
/100
|
#307
Tragic
21.4%
Immigrants | Bangladesh
0.0
/100
|
#308
Tragic
21.5%
Natives/Alaskans
0.0
/100
|
#309
Tragic
21.5%
Vietnamese
0.0
/100
|
#310
Tragic
21.5%