Immigrants from Yemen vs Dutch Unemployment Among Ages 25 to 29 years

COMPARE

Immigrants from Yemen
Race
Ancestry
AfghanAfricanAlaska NativeAlaskan AthabascanAlbanianAleutAlsatianAmericanApacheArabArapahoArgentineanArmenianAssyrian/Chaldean/SyriacAustralianAustrianBahamianBangladeshiBarbadianBasqueBelgianBelizeanBermudanBhutaneseBlackfeetBolivianBrazilianBritishBritish West IndianBulgarianBurmeseCajunCambodianCanadianCape VerdeanCarpatho RusynCelticCentral AmericanCentral American IndianCherokeeCheyenneChickasawChileanChineseChippewaChoctawColombianColvilleComancheCosta RicanCreeCreekCroatianCrowCubanCypriotCzechCzechoslovakianDanishDelawareDominicanDutch West IndianEastern EuropeanEcuadorianEgyptianEnglishEstonianEthiopianEuropeanFijianFilipinoFinnishFrenchFrench American IndianFrench CanadianGermanGerman RussianGhanaianGreekGuamanian/ChamorroGuatemalanGuyaneseHaitianHmongHonduranHopiHoumaHungarianIcelanderIndian (Asian)IndonesianInupiatIranianIraqiIrishIroquoisIsraeliItalianJamaicanJapaneseJordanianKenyanKiowaKoreanLaotianLatvianLebaneseLiberianLithuanianLumbeeLuxembourgerMacedonianMalaysianMalteseMarshalleseMenomineeMexicanMexican American IndianMongolianMoroccanNative HawaiianNavajoNepaleseNew ZealanderNicaraguanNigerianNorthern EuropeanNorwegianOkinawanOsageOttawaPaiutePakistaniPalestinianPanamanianParaguayanPennsylvania GermanPeruvianPimaPolishPortuguesePotawatomiPuebloPuerto RicanPuget Sound SalishRomanianRussianSalvadoranSamoanScandinavianScotch-IrishScottishSeminoleSenegaleseSerbianShoshoneSierra LeoneanSiouxSlavicSlovakSloveneSomaliSouth AfricanSouth AmericanSouth American IndianSoviet UnionSpaniardSpanishSpanish AmericanSpanish American IndianSri LankanSubsaharan AfricanSudaneseSwedishSwissSyrianTaiwaneseThaiTlingit-HaidaTohono O'OdhamTonganTrinidadian and TobagonianTsimshianTurkishU.S. Virgin IslanderUgandanUkrainianUruguayanUteVenezuelanVietnameseWelshWest IndianYakamaYaquiYugoslavianYumanYup'ikZimbabwean
Immigration
NonimmigrantsImmigrantsAfghanistanAfricaAlbaniaArgentinaArmeniaAsiaAustraliaAustriaBahamasBangladeshBarbadosBelarusBelgiumBelizeBoliviaBosnia and HerzegovinaBrazilBulgariaBurma/MyanmarCabo VerdeCambodiaCameroonCanadaCaribbeanCentral AmericaChileChinaColombiaCongoCosta RicaCroatiaCubaCzechoslovakiaDenmarkDominicaDominican RepublicEastern AfricaEastern AsiaEastern EuropeEcuadorEgyptEl SalvadorEnglandEritreaEthiopiaEuropeFijiFranceGermanyGhanaGreeceGrenadaGuatemalaGuyanaHaitiHondurasHong KongHungaryIndiaIndonesiaIranIraqIrelandIsraelItalyJamaicaJapanJordanKazakhstanKenyaKoreaKuwaitLaosLatin AmericaLatviaLebanonLiberiaLithuaniaMalaysiaMexicoMicronesiaMiddle AfricaMoldovaMoroccoNepalNetherlandsNicaraguaNigeriaNorth AmericaNorth MacedoniaNorthern AfricaNorthern EuropeNorwayOceaniaPakistanPanamaPeruPhilippinesPolandPortugalRomaniaRussiaSaudi ArabiaScotlandSenegalSerbiaSierra LeoneSingaporeSomaliaSouth AfricaSouth AmericaSouth Central AsiaSouth Eastern AsiaSouthern EuropeSpainSri LankaSt. Vincent and the GrenadinesSudanSwedenSwitzerlandSyriaTaiwanThailandTrinidad and TobagoTurkeyUgandaUkraineUruguayUzbekistanVenezuelaVietnamWest IndiesWestern AfricaWestern AsiaWestern EuropeYemenZaireZimbabweAzores
Dutch
Race
Ancestry
AfghanAfricanAlaska NativeAlaskan AthabascanAlbanianAleutAlsatianAmericanApacheArabArapahoArgentineanArmenianAssyrian/Chaldean/SyriacAustralianAustrianBahamianBangladeshiBarbadianBasqueBelgianBelizeanBermudanBhutaneseBlackfeetBolivianBrazilianBritishBritish West IndianBulgarianBurmeseCajunCambodianCanadianCape VerdeanCarpatho RusynCelticCentral AmericanCentral American IndianCherokeeCheyenneChickasawChileanChineseChippewaChoctawColombianColvilleComancheCosta RicanCreeCreekCroatianCrowCubanCypriotCzechCzechoslovakianDanishDelawareDominicanDutchDutch West IndianEastern EuropeanEcuadorianEgyptianEnglishEstonianEthiopianEuropeanFijianFilipinoFinnishFrenchFrench American IndianFrench CanadianGermanGerman RussianGhanaianGreekGuamanian/ChamorroGuatemalanGuyaneseHaitianHmongHonduranHopiHoumaHungarianIcelanderIndian (Asian)IndonesianInupiatIranianIraqiIrishIroquoisIsraeliItalianJamaicanJapaneseJordanianKenyanKiowaKoreanLaotianLatvianLebaneseLiberianLithuanianLumbeeLuxembourgerMacedonianMalaysianMalteseMarshalleseMenomineeMexicanMexican American IndianMongolianMoroccanNative HawaiianNavajoNepaleseNew ZealanderNicaraguanNigerianNorthern EuropeanNorwegianOkinawanOsageOttawaPaiutePakistaniPalestinianPanamanianParaguayanPennsylvania GermanPeruvianPimaPolishPortuguesePotawatomiPuebloPuerto RicanPuget Sound SalishRomanianRussianSalvadoranSamoanScandinavianScotch-IrishScottishSeminoleSenegaleseSerbianShoshoneSierra LeoneanSiouxSlavicSlovakSloveneSomaliSouth AfricanSouth AmericanSouth American IndianSoviet UnionSpaniardSpanishSpanish AmericanSpanish American IndianSri LankanSubsaharan AfricanSudaneseSwedishSwissSyrianTaiwaneseThaiTlingit-HaidaTohono O'OdhamTonganTrinidadian and TobagonianTsimshianTurkishU.S. Virgin IslanderUgandanUkrainianUruguayanUteVenezuelanVietnameseWelshWest IndianYakamaYaquiYugoslavianYumanYup'ikZimbabwean
Immigration
NonimmigrantsImmigrantsAfghanistanAfricaAlbaniaArgentinaArmeniaAsiaAustraliaAustriaBahamasBangladeshBarbadosBelarusBelgiumBelizeBoliviaBosnia and HerzegovinaBrazilBulgariaBurma/MyanmarCabo VerdeCambodiaCameroonCanadaCaribbeanCentral AmericaChileChinaColombiaCongoCosta RicaCroatiaCubaCzechoslovakiaDenmarkDominicaDominican RepublicEastern AfricaEastern AsiaEastern EuropeEcuadorEgyptEl SalvadorEnglandEritreaEthiopiaEuropeFijiFranceGermanyGhanaGreeceGrenadaGuatemalaGuyanaHaitiHondurasHong KongHungaryIndiaIndonesiaIranIraqIrelandIsraelItalyJamaicaJapanJordanKazakhstanKenyaKoreaKuwaitLaosLatin AmericaLatviaLebanonLiberiaLithuaniaMalaysiaMexicoMicronesiaMiddle AfricaMoldovaMoroccoNepalNetherlandsNicaraguaNigeriaNorth AmericaNorth MacedoniaNorthern AfricaNorthern EuropeNorwayOceaniaPakistanPanamaPeruPhilippinesPolandPortugalRomaniaRussiaSaudi ArabiaScotlandSenegalSerbiaSierra LeoneSingaporeSomaliaSouth AfricaSouth AmericaSouth Central AsiaSouth Eastern AsiaSouthern EuropeSpainSri LankaSt. Vincent and the GrenadinesSudanSwedenSwitzerlandSyriaTaiwanThailandTrinidad and TobagoTurkeyUgandaUkraineUruguayUzbekistanVenezuelaVietnamWest IndiesWestern AfricaWestern AsiaWestern EuropeZaireZimbabweAzores
Unemployment Among Ages 25 to 29 years
Income
Poverty
Unemployment
Labor Participation
Family Structure
Vehicle Availability
Education Level
Disability

Unemployment Among Ages 25 to 29 years Comparison

Immigrants from Yemen

Dutch

Tragic
Excellent
8.0%
UNEMPLOYMENT AMONG AGES 25 TO 29 YEARS
0.0/ 100
METRIC RATING
303rd/ 347
METRIC RANK
6.5%
UNEMPLOYMENT AMONG AGES 25 TO 29 YEARS
80.6/ 100
METRIC RATING
127th/ 347
METRIC RANK

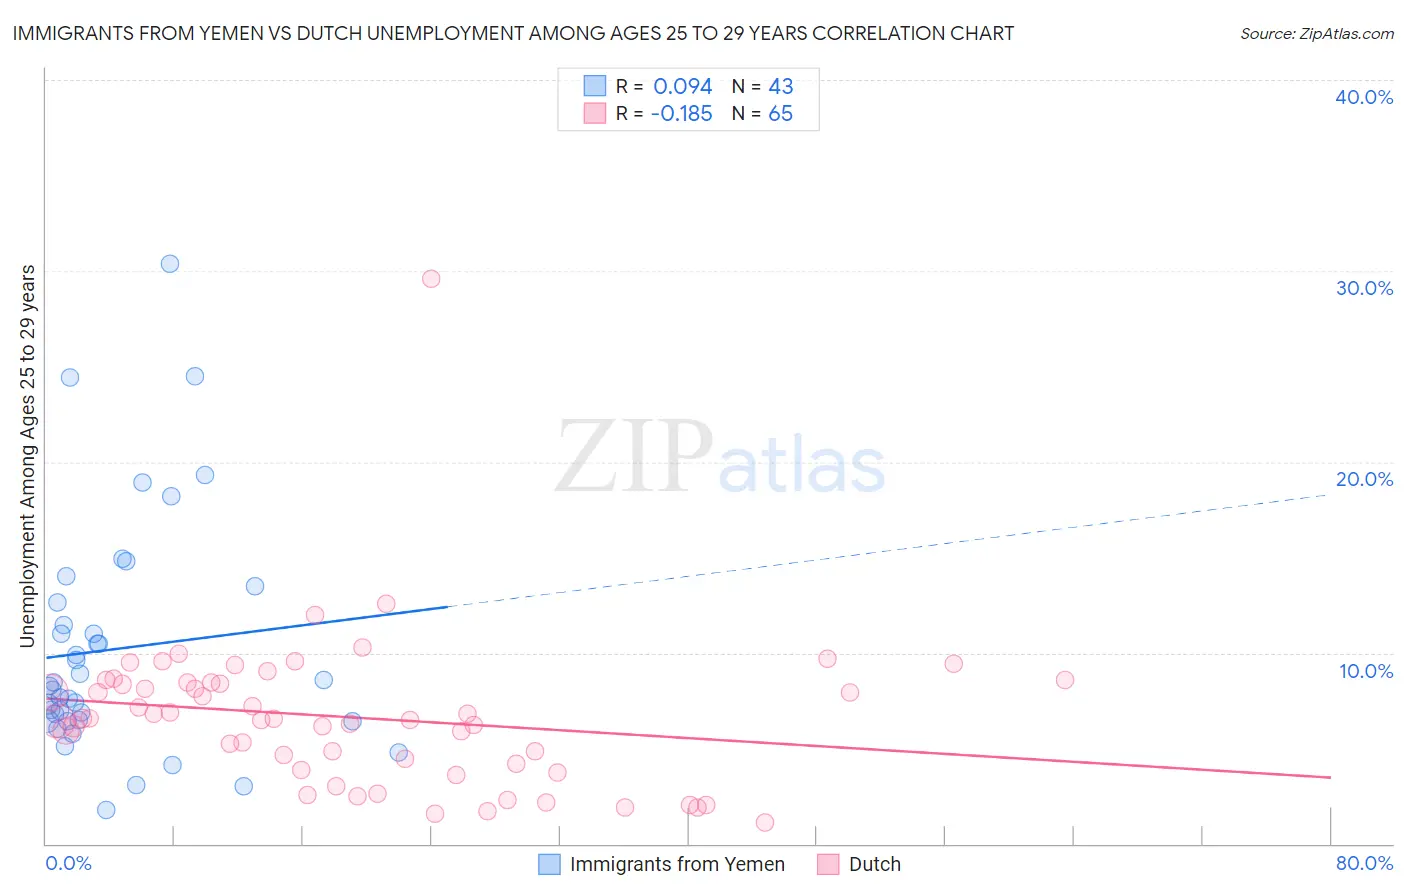
Immigrants from Yemen vs Dutch Unemployment Among Ages 25 to 29 years Correlation Chart

The statistical analysis conducted on geographies consisting of 81,785,794 people shows a slight positive correlation between the proportion of Immigrants from Yemen and unemployment rate among population between the ages 25 and 29 in the United States with a correlation coefficient (R) of 0.094 and weighted average of 8.0%. Similarly, the statistical analysis conducted on geographies consisting of 494,818,360 people shows a poor negative correlation between the proportion of Dutch and unemployment rate among population between the ages 25 and 29 in the United States with a correlation coefficient (R) of -0.185 and weighted average of 6.5%, a difference of 22.9%.
Immigrants from Yemen vs Dutch Unemployment Among Ages 25 to 29 years

Unemployment Among Ages 25 to 29 years Correlation Summary

MeasurementImmigrants from YemenDutch
Minimum1.8%1.1%
Maximum30.4%29.6%
Range28.6%28.5%
Mean10.2%6.6%
Median8.3%6.5%
Interquartile 25% (IQ1)6.4%4.0%
Interquartile 75% (IQ3)12.6%8.4%
Interquartile Range (IQR)6.2%4.4%
Standard Deviation (Sample)6.1%4.0%
Standard Deviation (Population)6.0%4.0%

Similar Demographics by Unemployment Among Ages 25 to 29 years

Demographics Similar to Immigrants from Yemen by Unemployment Among Ages 25 to 29 years

In terms of unemployment among ages 25 to 29 years, the demographic groups most similar to Immigrants from Yemen are Cajun (8.0%, a difference of 0.22%), Tsimshian (8.0%, a difference of 0.48%), Haitian (8.0%, a difference of 0.56%), Immigrants from Barbados (8.0%, a difference of 0.72%), and Jamaican (7.9%, a difference of 0.94%).
DemographicsRating | RankUnemployment Among Ages 25 to 29 years
Immigrants | West Indies
0.0
/100
|
#296
Tragic
7.8%
Blackfeet
0.0
/100
|
#297
Tragic
7.9%
Immigrants | Trinidad and Tobago
0.0
/100
|
#298
Tragic
7.9%
Barbadians
0.0
/100
|
#299
Tragic
7.9%
Central American Indians
0.0
/100
|
#300
Tragic
7.9%
West Indians
0.0
/100
|
#301
Tragic
7.9%
Jamaicans
0.0
/100
|
#302
Tragic
7.9%
Immigrants | Yemen
0.0
/100
|
#303
Tragic
8.0%
Cajuns
0.0
/100
|
#304
Tragic
8.0%
Tsimshian
0.0
/100
|
#305
Tragic
8.0%
Haitians
0.0
/100
|
#306
Tragic
8.0%
Immigrants | Barbados
0.0
/100
|
#307
Tragic
8.0%
Immigrants | Jamaica
0.0
/100
|
#308
Tragic
8.1%
Immigrants | Haiti
0.0
/100
|
#309
Tragic
8.1%
U.S. Virgin Islanders
0.0
/100
|
#310
Tragic
8.1%

Demographics Similar to Dutch by Unemployment Among Ages 25 to 29 years

In terms of unemployment among ages 25 to 29 years, the demographic groups most similar to Dutch are Immigrants from Chile (6.5%, a difference of 0.020%), Sri Lankan (6.5%, a difference of 0.040%), Immigrants from Peru (6.5%, a difference of 0.070%), Brazilian (6.5%, a difference of 0.13%), and Immigrants from Afghanistan (6.5%, a difference of 0.14%).
DemographicsRating | RankUnemployment Among Ages 25 to 29 years
Immigrants | Moldova
84.5
/100
|
#120
Excellent
6.5%
Immigrants | Uganda
84.5
/100
|
#121
Excellent
6.5%
Immigrants | Belarus
83.7
/100
|
#122
Excellent
6.5%
Laotians
83.6
/100
|
#123
Excellent
6.5%
Arabs
82.5
/100
|
#124
Excellent
6.5%
Syrians
82.1
/100
|
#125
Excellent
6.5%
Brazilians
81.9
/100
|
#126
Excellent
6.5%
Dutch
80.6
/100
|
#127
Excellent
6.5%
Immigrants | Chile
80.5
/100
|
#128
Excellent
6.5%
Sri Lankans
80.3
/100
|
#129
Excellent
6.5%
Immigrants | Peru
79.9
/100
|
#130
Good
6.5%
Immigrants | Afghanistan
79.2
/100
|
#131
Good
6.5%
Poles
76.6
/100
|
#132
Good
6.5%
Immigrants | Europe
75.7
/100
|
#133
Good
6.5%
Immigrants | Vietnam
75.6
/100
|
#134
Good
6.5%