Immigrants from Western Asia vs Norwegian Unemployment Among Ages 16 to 19 years

COMPARE

Immigrants from Western Asia
Race
Ancestry
AfghanAfricanAlaska NativeAlaskan AthabascanAlbanianAleutAlsatianAmericanApacheArabArapahoArgentineanArmenianAssyrian/Chaldean/SyriacAustralianAustrianBahamianBangladeshiBarbadianBasqueBelgianBelizeanBermudanBhutaneseBlackfeetBolivianBrazilianBritishBritish West IndianBulgarianBurmeseCajunCambodianCanadianCape VerdeanCarpatho RusynCelticCentral AmericanCentral American IndianCherokeeCheyenneChickasawChileanChineseChippewaChoctawColombianColvilleComancheCosta RicanCreeCreekCroatianCrowCubanCypriotCzechCzechoslovakianDanishDelawareDominicanDutchDutch West IndianEastern EuropeanEcuadorianEgyptianEnglishEstonianEthiopianEuropeanFijianFilipinoFinnishFrenchFrench American IndianFrench CanadianGermanGerman RussianGhanaianGreekGuamanian/ChamorroGuatemalanGuyaneseHaitianHmongHonduranHopiHoumaHungarianIcelanderIndian (Asian)IndonesianInupiatIranianIraqiIrishIroquoisIsraeliItalianJamaicanJapaneseJordanianKenyanKiowaKoreanLaotianLatvianLebaneseLiberianLithuanianLumbeeLuxembourgerMacedonianMalaysianMalteseMarshalleseMenomineeMexicanMexican American IndianMongolianMoroccanNative HawaiianNavajoNepaleseNew ZealanderNicaraguanNigerianNorthern EuropeanOkinawanOsageOttawaPaiutePakistaniPalestinianPanamanianParaguayanPennsylvania GermanPeruvianPimaPolishPortuguesePotawatomiPuebloPuerto RicanPuget Sound SalishRomanianRussianSalvadoranSamoanScandinavianScotch-IrishScottishSeminoleSenegaleseSerbianShoshoneSierra LeoneanSiouxSlavicSlovakSloveneSomaliSouth AfricanSouth AmericanSouth American IndianSoviet UnionSpaniardSpanishSpanish AmericanSpanish American IndianSri LankanSubsaharan AfricanSudaneseSwedishSwissSyrianTaiwaneseThaiTlingit-HaidaTohono O'OdhamTonganTrinidadian and TobagonianTsimshianTurkishU.S. Virgin IslanderUgandanUkrainianUruguayanUteVenezuelanVietnameseWelshWest IndianYakamaYaquiYugoslavianYumanYup'ikZimbabwean
Immigration
NonimmigrantsImmigrantsAfghanistanAfricaAlbaniaArgentinaArmeniaAsiaAustraliaAustriaBahamasBangladeshBarbadosBelarusBelgiumBelizeBoliviaBosnia and HerzegovinaBrazilBulgariaBurma/MyanmarCabo VerdeCambodiaCameroonCanadaCaribbeanCentral AmericaChileChinaColombiaCongoCosta RicaCroatiaCubaCzechoslovakiaDenmarkDominicaDominican RepublicEastern AfricaEastern AsiaEastern EuropeEcuadorEgyptEl SalvadorEnglandEritreaEthiopiaEuropeFijiFranceGermanyGhanaGreeceGrenadaGuatemalaGuyanaHaitiHondurasHong KongHungaryIndiaIndonesiaIranIraqIrelandIsraelItalyJamaicaJapanJordanKazakhstanKenyaKoreaKuwaitLaosLatin AmericaLatviaLebanonLiberiaLithuaniaMalaysiaMexicoMicronesiaMiddle AfricaMoldovaMoroccoNepalNetherlandsNicaraguaNigeriaNorth AmericaNorth MacedoniaNorthern AfricaNorthern EuropeNorwayOceaniaPakistanPanamaPeruPhilippinesPolandPortugalRomaniaRussiaSaudi ArabiaScotlandSenegalSerbiaSierra LeoneSingaporeSomaliaSouth AfricaSouth AmericaSouth Central AsiaSouth Eastern AsiaSouthern EuropeSpainSri LankaSt. Vincent and the GrenadinesSudanSwedenSwitzerlandSyriaTaiwanThailandTrinidad and TobagoTurkeyUgandaUkraineUruguayUzbekistanVenezuelaVietnamWest IndiesWestern AfricaWestern AsiaWestern EuropeYemenZaireZimbabweAzores
Norwegian
Race
Ancestry
AfghanAfricanAlaska NativeAlaskan AthabascanAlbanianAleutAlsatianAmericanApacheArabArapahoArgentineanArmenianAssyrian/Chaldean/SyriacAustralianAustrianBahamianBangladeshiBarbadianBasqueBelgianBelizeanBermudanBhutaneseBlackfeetBolivianBrazilianBritishBritish West IndianBulgarianBurmeseCajunCambodianCanadianCape VerdeanCarpatho RusynCelticCentral AmericanCentral American IndianCherokeeCheyenneChickasawChileanChineseChippewaChoctawColombianColvilleComancheCosta RicanCreeCreekCroatianCrowCubanCypriotCzechCzechoslovakianDanishDelawareDominicanDutchDutch West IndianEastern EuropeanEcuadorianEgyptianEnglishEstonianEthiopianEuropeanFijianFilipinoFinnishFrenchFrench American IndianFrench CanadianGermanGerman RussianGhanaianGreekGuamanian/ChamorroGuatemalanGuyaneseHaitianHmongHonduranHopiHoumaHungarianIcelanderIndian (Asian)IndonesianInupiatIranianIraqiIrishIroquoisIsraeliItalianJamaicanJapaneseJordanianKenyanKiowaKoreanLaotianLatvianLebaneseLiberianLithuanianLumbeeLuxembourgerMacedonianMalaysianMalteseMarshalleseMenomineeMexicanMexican American IndianMongolianMoroccanNative HawaiianNavajoNepaleseNew ZealanderNicaraguanNigerianNorthern EuropeanNorwegianOkinawanOsageOttawaPaiutePakistaniPalestinianPanamanianParaguayanPennsylvania GermanPeruvianPimaPolishPortuguesePotawatomiPuebloPuerto RicanPuget Sound SalishRomanianRussianSalvadoranSamoanScandinavianScotch-IrishScottishSeminoleSenegaleseSerbianShoshoneSierra LeoneanSiouxSlavicSlovakSloveneSomaliSouth AfricanSouth AmericanSouth American IndianSoviet UnionSpaniardSpanishSpanish AmericanSpanish American IndianSri LankanSubsaharan AfricanSudaneseSwedishSwissSyrianTaiwaneseThaiTlingit-HaidaTohono O'OdhamTonganTrinidadian and TobagonianTsimshianTurkishU.S. Virgin IslanderUgandanUkrainianUruguayanUteVenezuelanVietnameseWelshWest IndianYakamaYaquiYugoslavianYumanYup'ikZimbabwean
Immigration
NonimmigrantsImmigrantsAfghanistanAfricaAlbaniaArgentinaArmeniaAsiaAustraliaAustriaBahamasBangladeshBarbadosBelarusBelgiumBelizeBoliviaBosnia and HerzegovinaBrazilBulgariaBurma/MyanmarCabo VerdeCambodiaCameroonCanadaCaribbeanCentral AmericaChileChinaColombiaCongoCosta RicaCroatiaCubaCzechoslovakiaDenmarkDominicaDominican RepublicEastern AfricaEastern AsiaEastern EuropeEcuadorEgyptEl SalvadorEnglandEritreaEthiopiaEuropeFijiFranceGermanyGhanaGreeceGrenadaGuatemalaGuyanaHaitiHondurasHong KongHungaryIndiaIndonesiaIranIraqIrelandIsraelItalyJamaicaJapanJordanKazakhstanKenyaKoreaKuwaitLaosLatin AmericaLatviaLebanonLiberiaLithuaniaMalaysiaMexicoMicronesiaMiddle AfricaMoldovaMoroccoNepalNetherlandsNicaraguaNigeriaNorth AmericaNorth MacedoniaNorthern AfricaNorthern EuropeNorwayOceaniaPakistanPanamaPeruPhilippinesPolandPortugalRomaniaRussiaSaudi ArabiaScotlandSenegalSerbiaSierra LeoneSingaporeSomaliaSouth AfricaSouth AmericaSouth Central AsiaSouth Eastern AsiaSouthern EuropeSpainSri LankaSt. Vincent and the GrenadinesSudanSwedenSwitzerlandSyriaTaiwanThailandTrinidad and TobagoTurkeyUgandaUkraineUruguayUzbekistanVenezuelaVietnamWest IndiesWestern AfricaWestern EuropeYemenZaireZimbabweAzores
Unemployment Among Ages 16 to 19 years
Income
Poverty
Unemployment
Labor Participation
Family Structure
Vehicle Availability
Education Level
Disability

Unemployment Among Ages 16 to 19 years Comparison

Immigrants from Western Asia

Norwegians

Poor
Exceptional
18.0%
UNEMPLOYMENT AMONG AGES 16 TO 19 YEARS
10.2/ 100
METRIC RATING
223rd/ 347
METRIC RANK
14.5%
UNEMPLOYMENT AMONG AGES 16 TO 19 YEARS
100.0/ 100
METRIC RATING
1st/ 347
METRIC RANK

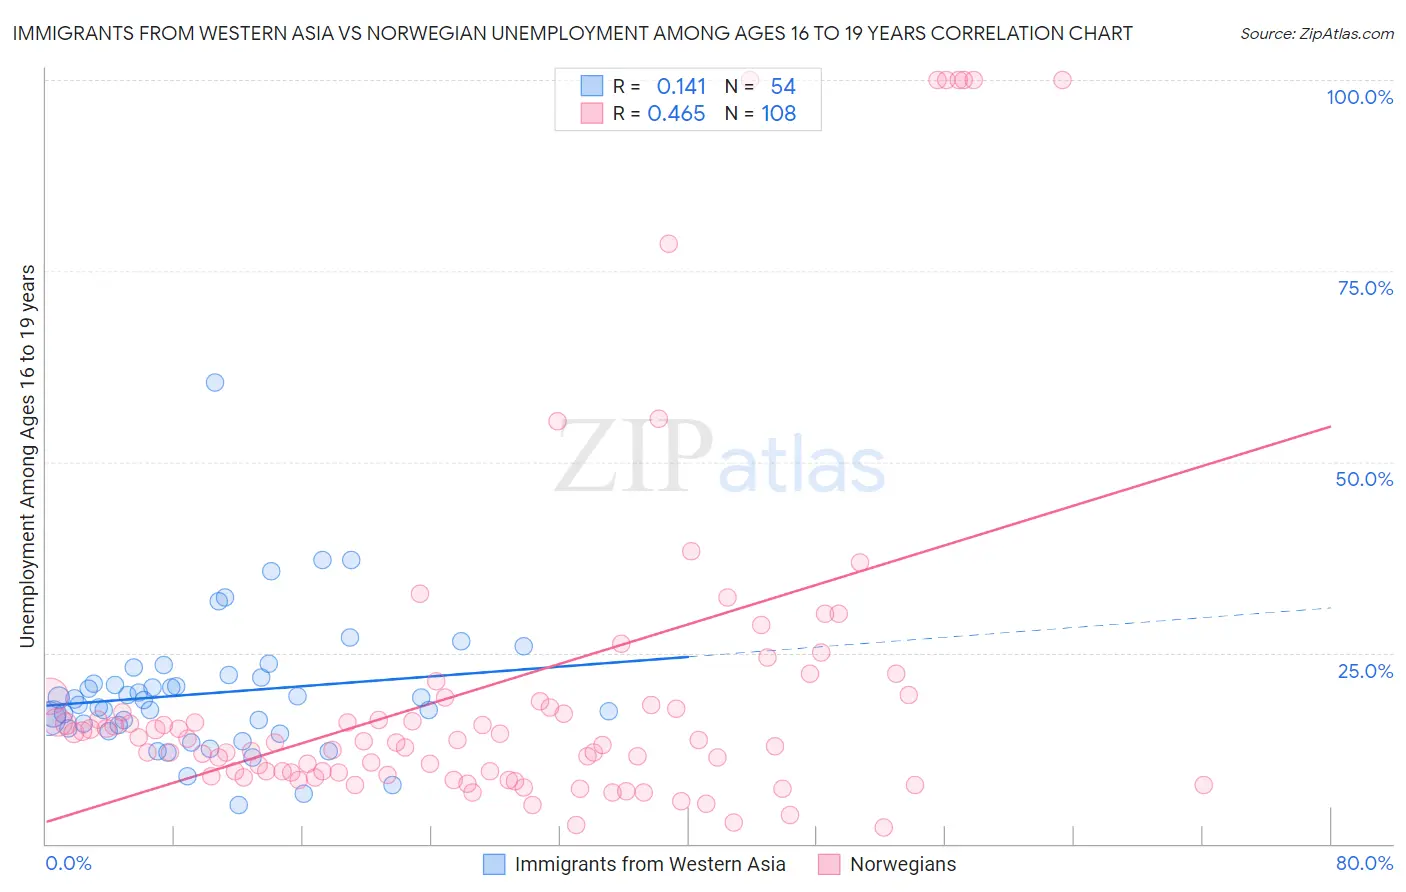
Immigrants from Western Asia vs Norwegian Unemployment Among Ages 16 to 19 years Correlation Chart

The statistical analysis conducted on geographies consisting of 383,948,107 people shows a poor positive correlation between the proportion of Immigrants from Western Asia and unemployment rate among population between the ages 16 and 19 in the United States with a correlation coefficient (R) of 0.141 and weighted average of 18.0%. Similarly, the statistical analysis conducted on geographies consisting of 482,240,820 people shows a moderate positive correlation between the proportion of Norwegians and unemployment rate among population between the ages 16 and 19 in the United States with a correlation coefficient (R) of 0.465 and weighted average of 14.5%, a difference of 24.2%.
Immigrants from Western Asia vs Norwegian Unemployment Among Ages 16 to 19 years

Unemployment Among Ages 16 to 19 years Correlation Summary

MeasurementImmigrants from Western AsiaNorwegian
Minimum5.1%2.1%
Maximum60.5%100.0%
Range55.3%97.9%
Mean19.7%20.8%
Median18.5%13.5%
Interquartile 25% (IQ1)15.1%9.3%
Interquartile 75% (IQ3)21.7%18.4%
Interquartile Range (IQR)6.6%9.1%
Standard Deviation (Sample)8.9%23.6%
Standard Deviation (Population)8.8%23.5%

Similar Demographics by Unemployment Among Ages 16 to 19 years

Demographics Similar to Immigrants from Western Asia by Unemployment Among Ages 16 to 19 years

In terms of unemployment among ages 16 to 19 years, the demographic groups most similar to Immigrants from Western Asia are Immigrants from Iran (18.0%, a difference of 0.060%), Immigrants from Albania (18.0%, a difference of 0.14%), Immigrants from Spain (18.0%, a difference of 0.14%), Immigrants from Africa (18.0%, a difference of 0.20%), and Immigrants from Argentina (18.0%, a difference of 0.27%).
DemographicsRating | RankUnemployment Among Ages 16 to 19 years
Immigrants | Kazakhstan
13.0
/100
|
#216
Poor
18.0%
South American Indians
13.0
/100
|
#217
Poor
18.0%
Immigrants | Argentina
12.5
/100
|
#218
Poor
18.0%
Immigrants | Africa
12.0
/100
|
#219
Poor
18.0%
Immigrants | Albania
11.4
/100
|
#220
Poor
18.0%
Immigrants | Spain
11.4
/100
|
#221
Poor
18.0%
Immigrants | Iran
10.7
/100
|
#222
Poor
18.0%
Immigrants | Western Asia
10.2
/100
|
#223
Poor
18.0%
Immigrants | Serbia
8.3
/100
|
#224
Tragic
18.1%
Immigrants | Chile
7.5
/100
|
#225
Tragic
18.1%
Immigrants | Belgium
7.3
/100
|
#226
Tragic
18.1%
Immigrants | Liberia
7.1
/100
|
#227
Tragic
18.1%
Immigrants | Greece
7.1
/100
|
#228
Tragic
18.1%
Albanians
5.8
/100
|
#229
Tragic
18.2%
Spanish Americans
4.7
/100
|
#230
Tragic
18.2%

Demographics Similar to Norwegians by Unemployment Among Ages 16 to 19 years

In terms of unemployment among ages 16 to 19 years, the demographic groups most similar to Norwegians are Immigrants from India (15.0%, a difference of 3.4%), Luxembourger (15.1%, a difference of 3.8%), Danish (15.2%, a difference of 4.6%), Immigrants from Somalia (15.3%, a difference of 5.2%), and Swedish (15.3%, a difference of 5.5%).
DemographicsRating | RankUnemployment Among Ages 16 to 19 years
Norwegians
100.0
/100
|
#1
Exceptional
14.5%
Immigrants | India
100.0
/100
|
#2
Exceptional
15.0%
Luxembourgers
100.0
/100
|
#3
Exceptional
15.1%
Danes
100.0
/100
|
#4
Exceptional
15.2%
Immigrants | Somalia
100.0
/100
|
#5
Exceptional
15.3%
Swedes
100.0
/100
|
#6
Exceptional
15.3%
Immigrants | Bosnia and Herzegovina
100.0
/100
|
#7
Exceptional
15.3%
Czechs
100.0
/100
|
#8
Exceptional
15.4%
Scandinavians
100.0
/100
|
#9
Exceptional
15.4%
Zimbabweans
100.0
/100
|
#10
Exceptional
15.4%
Indonesians
100.0
/100
|
#11
Exceptional
15.5%
Taiwanese
100.0
/100
|
#12
Exceptional
15.5%
Immigrants | Burma/Myanmar
100.0
/100
|
#13
Exceptional
15.6%
Immigrants | Zaire
100.0
/100
|
#14
Exceptional
15.6%
Yugoslavians
100.0
/100
|
#15
Exceptional
15.6%