Immigrants from Western Asia vs Immigrants from Saudi Arabia Unemployment Among Seniors over 65 years
COMPARE
Immigrants from Western Asia
Immigrants from Saudi Arabia
Unemployment Among Seniors over 65 years
Unemployment Among Seniors over 65 years Comparison
Immigrants from Western Asia
Immigrants from Saudi Arabia
5.2%
UNEMPLOYMENT AMONG SENIORS OVER 65 YEARS
42.1/ 100
METRIC RATING
183rd/ 347
METRIC RANK
5.0%
UNEMPLOYMENT AMONG SENIORS OVER 65 YEARS
92.7/ 100
METRIC RATING
110th/ 347
METRIC RANK
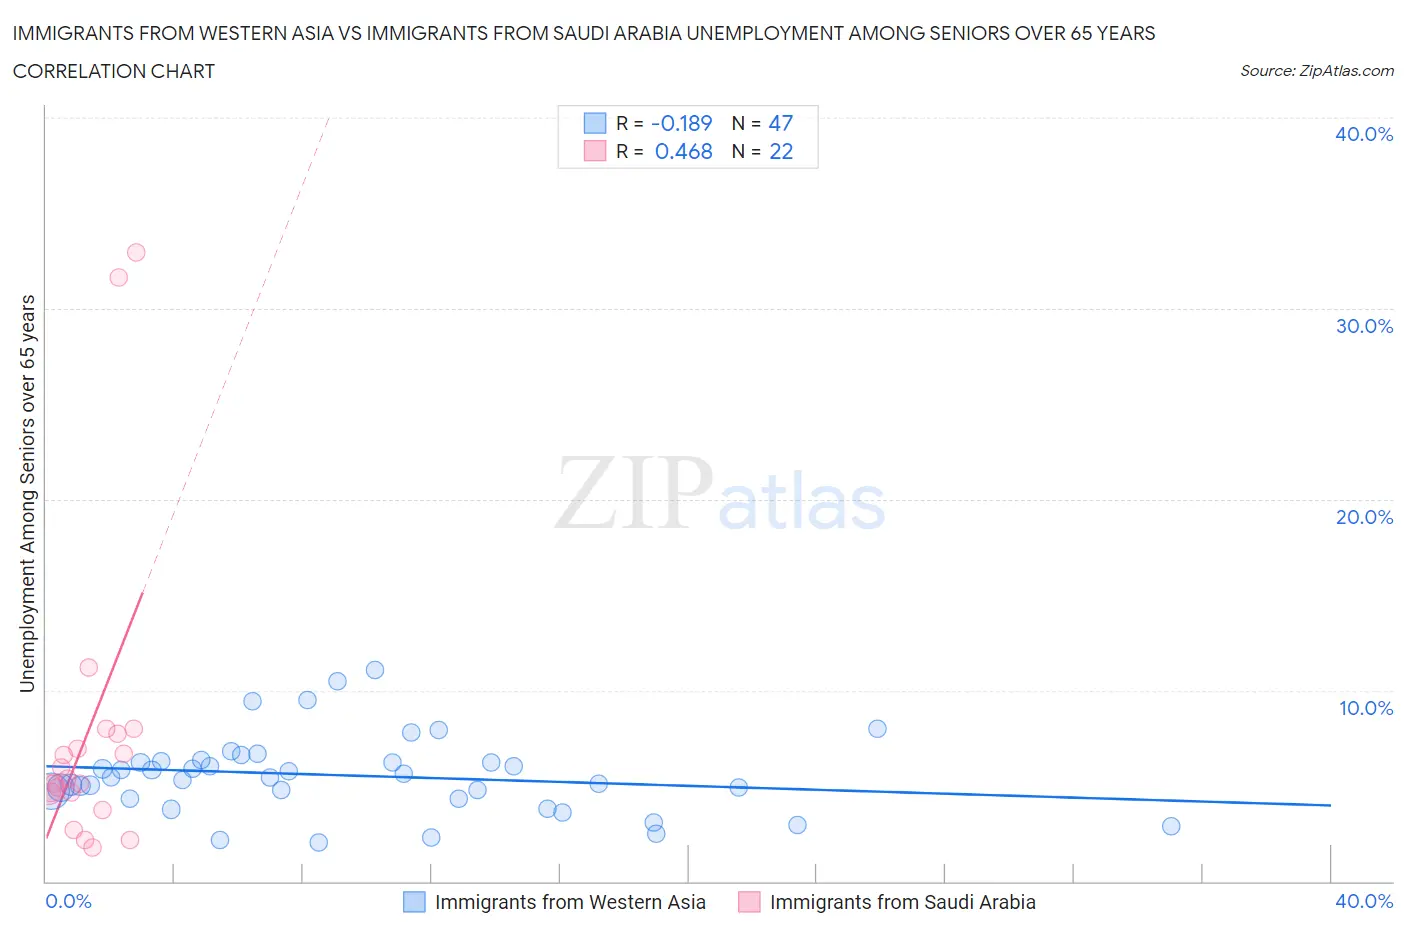
Immigrants from Western Asia vs Immigrants from Saudi Arabia Unemployment Among Seniors over 65 years Correlation Chart
The statistical analysis conducted on geographies consisting of 367,995,026 people shows a poor negative correlation between the proportion of Immigrants from Western Asia and unemployment rate amomg seniors over the age of 65 in the United States with a correlation coefficient (R) of -0.189 and weighted average of 5.2%. Similarly, the statistical analysis conducted on geographies consisting of 157,335,987 people shows a moderate positive correlation between the proportion of Immigrants from Saudi Arabia and unemployment rate amomg seniors over the age of 65 in the United States with a correlation coefficient (R) of 0.468 and weighted average of 5.0%, a difference of 2.3%.
Unemployment Among Seniors over 65 years Correlation Summary
| Measurement | Immigrants from Western Asia | Immigrants from Saudi Arabia |
| Minimum | 2.0% | 1.8% |
| Maximum | 11.1% | 32.9% |
| Range | 9.1% | 31.1% |
| Mean | 5.5% | 7.9% |
| Median | 5.5% | 5.3% |
| Interquartile 25% (IQ1) | 4.3% | 4.7% |
| Interquartile 75% (IQ3) | 6.3% | 7.7% |
| Interquartile Range (IQR) | 1.9% | 3.0% |
| Standard Deviation (Sample) | 2.0% | 8.2% |
| Standard Deviation (Population) | 2.0% | 8.0% |
Similar Demographics by Unemployment Among Seniors over 65 years
Demographics Similar to Immigrants from Western Asia by Unemployment Among Seniors over 65 years
In terms of unemployment among seniors over 65 years, the demographic groups most similar to Immigrants from Western Asia are Immigrants from Serbia (5.2%, a difference of 0.020%), Panamanian (5.2%, a difference of 0.030%), Immigrants from Italy (5.2%, a difference of 0.040%), Russian (5.2%, a difference of 0.050%), and Immigrants from Somalia (5.2%, a difference of 0.060%).
| Demographics | Rating | Rank | Unemployment Among Seniors over 65 years |
| Indians (Asian) | 46.6 /100 | #176 | Average 5.2% |
| Icelanders | 45.9 /100 | #177 | Average 5.2% |
| Immigrants | Belgium | 44.8 /100 | #178 | Average 5.2% |
| Immigrants | Somalia | 44.0 /100 | #179 | Average 5.2% |
| Russians | 43.6 /100 | #180 | Average 5.2% |
| Immigrants | Italy | 43.5 /100 | #181 | Average 5.2% |
| Panamanians | 43.0 /100 | #182 | Average 5.2% |
| Immigrants | Western Asia | 42.1 /100 | #183 | Average 5.2% |
| Immigrants | Serbia | 41.6 /100 | #184 | Average 5.2% |
| Immigrants | Iran | 36.0 /100 | #185 | Fair 5.2% |
| Americans | 35.1 /100 | #186 | Fair 5.2% |
| Somalis | 33.5 /100 | #187 | Fair 5.2% |
| Immigrants | Egypt | 33.2 /100 | #188 | Fair 5.2% |
| Bangladeshis | 32.3 /100 | #189 | Fair 5.2% |
| Koreans | 31.6 /100 | #190 | Fair 5.2% |
Demographics Similar to Immigrants from Saudi Arabia by Unemployment Among Seniors over 65 years
In terms of unemployment among seniors over 65 years, the demographic groups most similar to Immigrants from Saudi Arabia are Immigrants from Malaysia (5.0%, a difference of 0.010%), Immigrants from Vietnam (5.0%, a difference of 0.030%), Immigrants from Germany (5.0%, a difference of 0.060%), Finnish (5.0%, a difference of 0.060%), and Eastern European (5.0%, a difference of 0.080%).
| Demographics | Rating | Rank | Unemployment Among Seniors over 65 years |
| Immigrants | Lithuania | 95.1 /100 | #103 | Exceptional 5.0% |
| Immigrants | Scotland | 95.0 /100 | #104 | Exceptional 5.0% |
| Okinawans | 94.7 /100 | #105 | Exceptional 5.0% |
| Immigrants | Turkey | 94.3 /100 | #106 | Exceptional 5.0% |
| Immigrants | Germany | 93.2 /100 | #107 | Exceptional 5.0% |
| Immigrants | Vietnam | 92.9 /100 | #108 | Exceptional 5.0% |
| Immigrants | Malaysia | 92.7 /100 | #109 | Exceptional 5.0% |
| Immigrants | Saudi Arabia | 92.7 /100 | #110 | Exceptional 5.0% |
| Finns | 92.2 /100 | #111 | Exceptional 5.0% |
| Eastern Europeans | 92.0 /100 | #112 | Exceptional 5.0% |
| Seminole | 91.4 /100 | #113 | Exceptional 5.0% |
| Immigrants | Latvia | 91.4 /100 | #114 | Exceptional 5.0% |
| Celtics | 91.3 /100 | #115 | Exceptional 5.0% |
| Immigrants | Korea | 91.0 /100 | #116 | Exceptional 5.0% |
| Malaysians | 90.4 /100 | #117 | Exceptional 5.1% |