Immigrants from Western Africa vs Slovene Unemployment Among Youth under 25 years

COMPARE

Immigrants from Western Africa
Race
Ancestry
AfghanAfricanAlaska NativeAlaskan AthabascanAlbanianAleutAlsatianAmericanApacheArabArapahoArgentineanArmenianAssyrian/Chaldean/SyriacAustralianAustrianBahamianBangladeshiBarbadianBasqueBelgianBelizeanBermudanBhutaneseBlackfeetBolivianBrazilianBritishBritish West IndianBulgarianBurmeseCajunCambodianCanadianCape VerdeanCarpatho RusynCelticCentral AmericanCentral American IndianCherokeeCheyenneChickasawChileanChineseChippewaChoctawColombianColvilleComancheCosta RicanCreeCreekCroatianCrowCubanCypriotCzechCzechoslovakianDanishDelawareDominicanDutchDutch West IndianEastern EuropeanEcuadorianEgyptianEnglishEstonianEthiopianEuropeanFijianFilipinoFinnishFrenchFrench American IndianFrench CanadianGermanGerman RussianGhanaianGreekGuamanian/ChamorroGuatemalanGuyaneseHaitianHmongHonduranHopiHoumaHungarianIcelanderIndian (Asian)IndonesianInupiatIranianIraqiIrishIroquoisIsraeliItalianJamaicanJapaneseJordanianKenyanKiowaKoreanLaotianLatvianLebaneseLiberianLithuanianLumbeeLuxembourgerMacedonianMalaysianMalteseMarshalleseMenomineeMexicanMexican American IndianMongolianMoroccanNative HawaiianNavajoNepaleseNew ZealanderNicaraguanNigerianNorthern EuropeanNorwegianOkinawanOsageOttawaPaiutePakistaniPalestinianPanamanianParaguayanPennsylvania GermanPeruvianPimaPolishPortuguesePotawatomiPuebloPuerto RicanPuget Sound SalishRomanianRussianSalvadoranSamoanScandinavianScotch-IrishScottishSeminoleSenegaleseSerbianShoshoneSierra LeoneanSiouxSlavicSlovakSomaliSouth AfricanSouth AmericanSouth American IndianSoviet UnionSpaniardSpanishSpanish AmericanSpanish American IndianSri LankanSubsaharan AfricanSudaneseSwedishSwissSyrianTaiwaneseThaiTlingit-HaidaTohono O'OdhamTonganTrinidadian and TobagonianTsimshianTurkishU.S. Virgin IslanderUgandanUkrainianUruguayanUteVenezuelanVietnameseWelshWest IndianYakamaYaquiYugoslavianYumanYup'ikZimbabwean
Immigration
NonimmigrantsImmigrantsAfghanistanAfricaAlbaniaArgentinaArmeniaAsiaAustraliaAustriaBahamasBangladeshBarbadosBelarusBelgiumBelizeBoliviaBosnia and HerzegovinaBrazilBulgariaBurma/MyanmarCabo VerdeCambodiaCameroonCanadaCaribbeanCentral AmericaChileChinaColombiaCongoCosta RicaCroatiaCubaCzechoslovakiaDenmarkDominicaDominican RepublicEastern AfricaEastern AsiaEastern EuropeEcuadorEgyptEl SalvadorEnglandEritreaEthiopiaEuropeFijiFranceGermanyGhanaGreeceGrenadaGuatemalaGuyanaHaitiHondurasHong KongHungaryIndiaIndonesiaIranIraqIrelandIsraelItalyJamaicaJapanJordanKazakhstanKenyaKoreaKuwaitLaosLatin AmericaLatviaLebanonLiberiaLithuaniaMalaysiaMexicoMicronesiaMiddle AfricaMoldovaMoroccoNepalNetherlandsNicaraguaNigeriaNorth AmericaNorth MacedoniaNorthern AfricaNorthern EuropeNorwayOceaniaPakistanPanamaPeruPhilippinesPolandPortugalRomaniaRussiaSaudi ArabiaScotlandSenegalSerbiaSierra LeoneSingaporeSomaliaSouth AfricaSouth AmericaSouth Central AsiaSouth Eastern AsiaSouthern EuropeSpainSri LankaSt. Vincent and the GrenadinesSudanSwedenSwitzerlandSyriaTaiwanThailandTrinidad and TobagoTurkeyUgandaUkraineUruguayUzbekistanVenezuelaVietnamWest IndiesWestern AfricaWestern AsiaWestern EuropeYemenZaireZimbabweAzores
Slovene
Race
Ancestry
AfghanAfricanAlaska NativeAlaskan AthabascanAlbanianAleutAlsatianAmericanApacheArabArapahoArgentineanArmenianAssyrian/Chaldean/SyriacAustralianAustrianBahamianBangladeshiBarbadianBasqueBelgianBelizeanBermudanBhutaneseBlackfeetBolivianBrazilianBritishBritish West IndianBulgarianBurmeseCajunCambodianCanadianCape VerdeanCarpatho RusynCelticCentral AmericanCentral American IndianCherokeeCheyenneChickasawChileanChineseChippewaChoctawColombianColvilleComancheCosta RicanCreeCreekCroatianCrowCubanCypriotCzechCzechoslovakianDanishDelawareDominicanDutchDutch West IndianEastern EuropeanEcuadorianEgyptianEnglishEstonianEthiopianEuropeanFijianFilipinoFinnishFrenchFrench American IndianFrench CanadianGermanGerman RussianGhanaianGreekGuamanian/ChamorroGuatemalanGuyaneseHaitianHmongHonduranHopiHoumaHungarianIcelanderIndian (Asian)IndonesianInupiatIranianIraqiIrishIroquoisIsraeliItalianJamaicanJapaneseJordanianKenyanKiowaKoreanLaotianLatvianLebaneseLiberianLithuanianLumbeeLuxembourgerMacedonianMalaysianMalteseMarshalleseMenomineeMexicanMexican American IndianMongolianMoroccanNative HawaiianNavajoNepaleseNew ZealanderNicaraguanNigerianNorthern EuropeanNorwegianOkinawanOsageOttawaPaiutePakistaniPalestinianPanamanianParaguayanPennsylvania GermanPeruvianPimaPolishPortuguesePotawatomiPuebloPuerto RicanPuget Sound SalishRomanianRussianSalvadoranSamoanScandinavianScotch-IrishScottishSeminoleSenegaleseSerbianShoshoneSierra LeoneanSiouxSlavicSlovakSloveneSomaliSouth AfricanSouth AmericanSouth American IndianSoviet UnionSpaniardSpanishSpanish AmericanSpanish American IndianSri LankanSubsaharan AfricanSudaneseSwedishSwissSyrianTaiwaneseThaiTlingit-HaidaTohono O'OdhamTonganTrinidadian and TobagonianTsimshianTurkishU.S. Virgin IslanderUgandanUkrainianUruguayanUteVenezuelanVietnameseWelshWest IndianYakamaYaquiYugoslavianYumanYup'ikZimbabwean
Immigration
NonimmigrantsImmigrantsAfghanistanAfricaAlbaniaArgentinaArmeniaAsiaAustraliaAustriaBahamasBangladeshBarbadosBelarusBelgiumBelizeBoliviaBosnia and HerzegovinaBrazilBulgariaBurma/MyanmarCabo VerdeCambodiaCameroonCanadaCaribbeanCentral AmericaChileChinaColombiaCongoCosta RicaCroatiaCubaCzechoslovakiaDenmarkDominicaDominican RepublicEastern AfricaEastern AsiaEastern EuropeEcuadorEgyptEl SalvadorEnglandEritreaEthiopiaEuropeFijiFranceGermanyGhanaGreeceGrenadaGuatemalaGuyanaHaitiHondurasHong KongHungaryIndiaIndonesiaIranIraqIrelandIsraelItalyJamaicaJapanJordanKazakhstanKenyaKoreaKuwaitLaosLatin AmericaLatviaLebanonLiberiaLithuaniaMalaysiaMexicoMicronesiaMiddle AfricaMoldovaMoroccoNepalNetherlandsNicaraguaNigeriaNorth AmericaNorth MacedoniaNorthern AfricaNorthern EuropeNorwayOceaniaPakistanPanamaPeruPhilippinesPolandPortugalRomaniaRussiaSaudi ArabiaScotlandSenegalSerbiaSierra LeoneSingaporeSomaliaSouth AfricaSouth AmericaSouth Central AsiaSouth Eastern AsiaSouthern EuropeSpainSri LankaSt. Vincent and the GrenadinesSudanSwedenSwitzerlandSyriaTaiwanThailandTrinidad and TobagoTurkeyUgandaUkraineUruguayUzbekistanVenezuelaVietnamWest IndiesWestern AsiaWestern EuropeYemenZaireZimbabweAzores
Unemployment Among Youth under 25 years
Income
Poverty
Unemployment
Labor Participation
Family Structure
Vehicle Availability
Education Level
Disability

Unemployment Among Youth under 25 years Comparison

Immigrants from Western Africa

Slovenes

Tragic
Exceptional
13.4%
UNEMPLOYMENT AMONG YOUTH UNDER 25 YEARS
0.0/ 100
METRIC RATING
288th/ 347
METRIC RANK
10.7%
UNEMPLOYMENT AMONG YOUTH UNDER 25 YEARS
99.9/ 100
METRIC RATING
31st/ 347
METRIC RANK

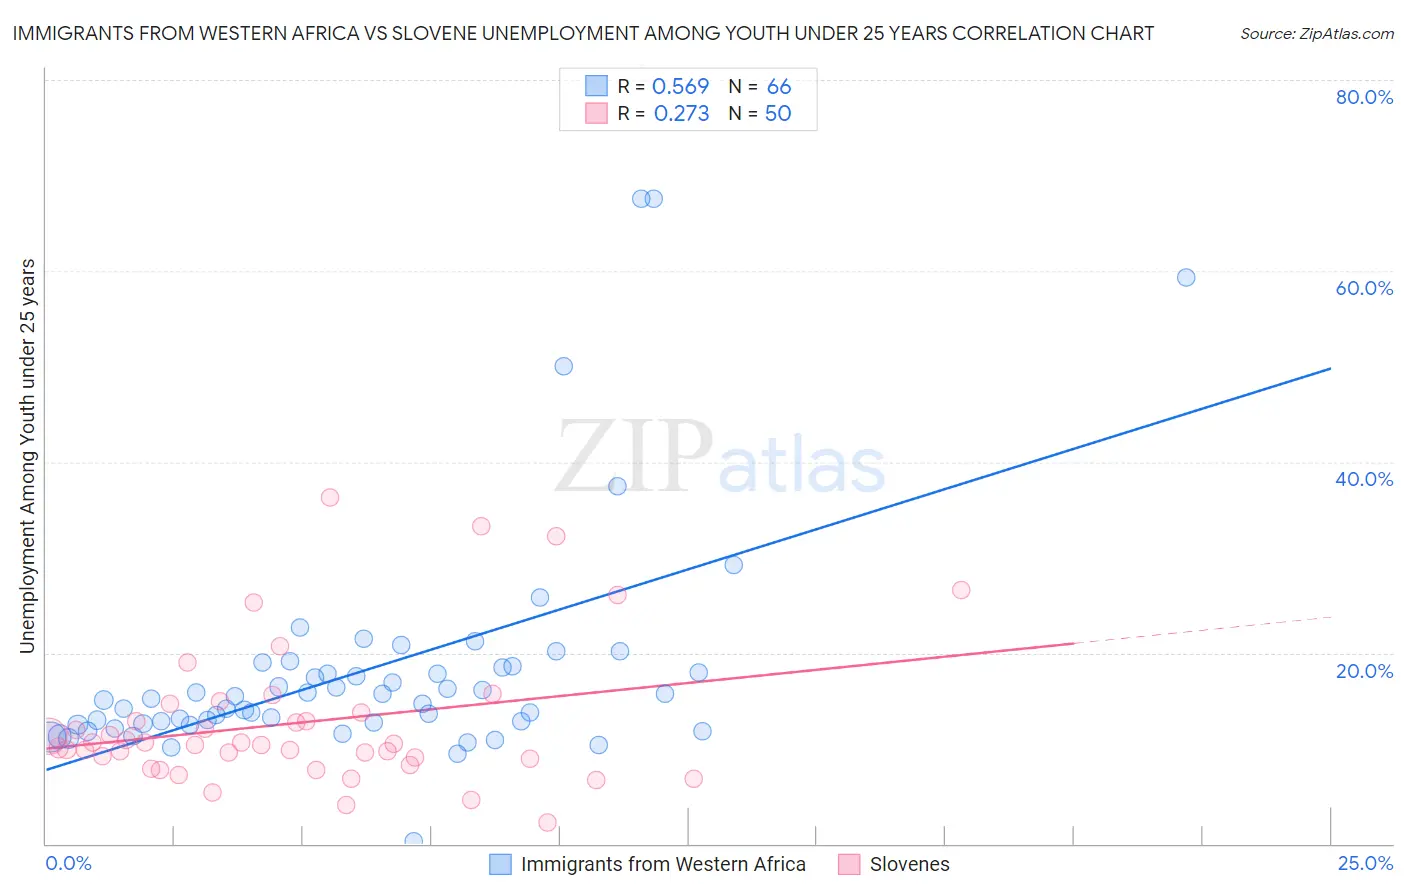
Immigrants from Western Africa vs Slovene Unemployment Among Youth under 25 years Correlation Chart

The statistical analysis conducted on geographies consisting of 355,169,530 people shows a substantial positive correlation between the proportion of Immigrants from Western Africa and unemployment rate among youth under the age of 25 in the United States with a correlation coefficient (R) of 0.569 and weighted average of 13.4%. Similarly, the statistical analysis conducted on geographies consisting of 258,426,260 people shows a weak positive correlation between the proportion of Slovenes and unemployment rate among youth under the age of 25 in the United States with a correlation coefficient (R) of 0.273 and weighted average of 10.7%, a difference of 24.6%.
Immigrants from Western Africa vs Slovene Unemployment Among Youth under 25 years

Unemployment Among Youth under 25 years Correlation Summary

MeasurementImmigrants from Western AfricaSlovene
Minimum0.30%2.2%
Maximum67.6%36.3%
Range67.3%34.1%
Mean18.2%12.7%
Median15.1%10.4%
Interquartile 25% (IQ1)12.6%8.9%
Interquartile 75% (IQ3)18.4%13.8%
Interquartile Range (IQR)5.9%4.9%
Standard Deviation (Sample)12.2%7.4%
Standard Deviation (Population)12.1%7.3%

Similar Demographics by Unemployment Among Youth under 25 years

Demographics Similar to Immigrants from Western Africa by Unemployment Among Youth under 25 years

In terms of unemployment among youth under 25 years, the demographic groups most similar to Immigrants from Western Africa are Immigrants from Ghana (13.4%, a difference of 0.11%), Blackfeet (13.3%, a difference of 0.43%), Ecuadorian (13.3%, a difference of 0.43%), Immigrants from Ecuador (13.4%, a difference of 0.46%), and Ghanaian (13.3%, a difference of 0.48%).
DemographicsRating | RankUnemployment Among Youth under 25 years
Armenians
0.0
/100
|
#281
Tragic
13.3%
Sierra Leoneans
0.0
/100
|
#282
Tragic
13.3%
Immigrants | Cameroon
0.0
/100
|
#283
Tragic
13.3%
Lumbee
0.0
/100
|
#284
Tragic
13.3%
Ghanaians
0.0
/100
|
#285
Tragic
13.3%
Blackfeet
0.0
/100
|
#286
Tragic
13.3%
Ecuadorians
0.0
/100
|
#287
Tragic
13.3%
Immigrants | Western Africa
0.0
/100
|
#288
Tragic
13.4%
Immigrants | Ghana
0.0
/100
|
#289
Tragic
13.4%
Immigrants | Ecuador
0.0
/100
|
#290
Tragic
13.4%
Apache
0.0
/100
|
#291
Tragic
13.5%
Central American Indians
0.0
/100
|
#292
Tragic
13.5%
Spanish American Indians
0.0
/100
|
#293
Tragic
13.5%
Immigrants | Caribbean
0.0
/100
|
#294
Tragic
13.5%
Chippewa
0.0
/100
|
#295
Tragic
13.5%

Demographics Similar to Slovenes by Unemployment Among Youth under 25 years

In terms of unemployment among youth under 25 years, the demographic groups most similar to Slovenes are Osage (10.7%, a difference of 0.11%), Chinese (10.7%, a difference of 0.18%), Taiwanese (10.8%, a difference of 0.26%), European (10.8%, a difference of 0.48%), and Somali (10.7%, a difference of 0.52%).
DemographicsRating | RankUnemployment Among Youth under 25 years
Finns
100.0
/100
|
#24
Exceptional
10.7%
Immigrants | North Macedonia
100.0
/100
|
#25
Exceptional
10.7%
Immigrants | India
100.0
/100
|
#26
Exceptional
10.7%
Yugoslavians
100.0
/100
|
#27
Exceptional
10.7%
Somalis
100.0
/100
|
#28
Exceptional
10.7%
Chinese
99.9
/100
|
#29
Exceptional
10.7%
Osage
99.9
/100
|
#30
Exceptional
10.7%
Slovenes
99.9
/100
|
#31
Exceptional
10.7%
Taiwanese
99.9
/100
|
#32
Exceptional
10.8%
Europeans
99.9
/100
|
#33
Exceptional
10.8%
English
99.9
/100
|
#34
Exceptional
10.8%
Immigrants | Nepal
99.9
/100
|
#35
Exceptional
10.8%
Hmong
99.8
/100
|
#36
Exceptional
10.8%
Immigrants | Zimbabwe
99.8
/100
|
#37
Exceptional
10.8%
Immigrants | Congo
99.8
/100
|
#38
Exceptional
10.9%