Immigrants from Western Africa vs Pueblo Male Unemployment
COMPARE
Immigrants from Western Africa
Pueblo
Male Unemployment
Male Unemployment Comparison
Immigrants from Western Africa
Pueblo
6.2%
MALE UNEMPLOYMENT
0.0/ 100
METRIC RATING
283rd/ 347
METRIC RANK
8.5%
MALE UNEMPLOYMENT
0.0/ 100
METRIC RATING
335th/ 347
METRIC RANK
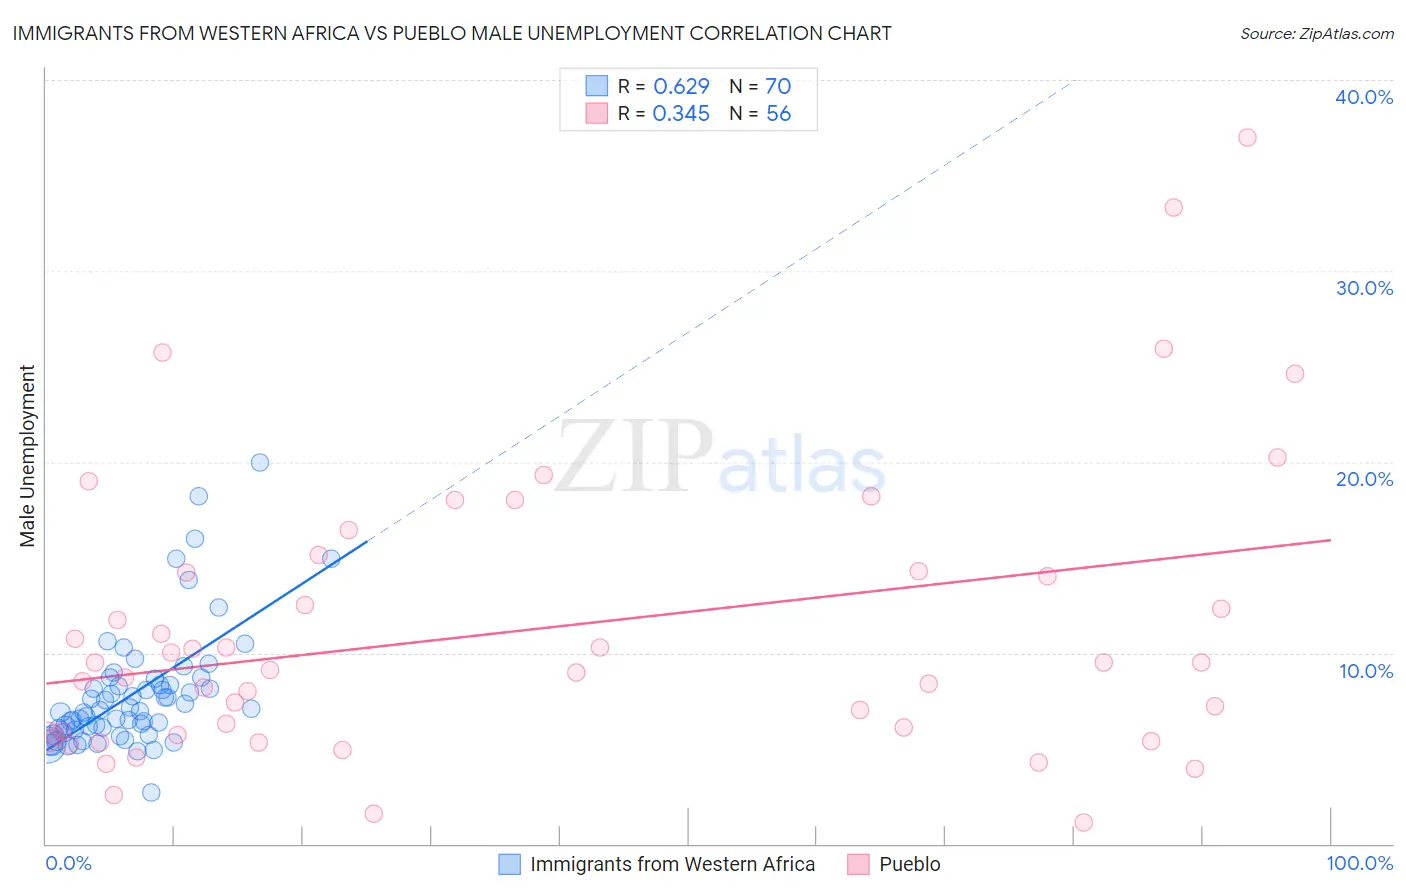
Immigrants from Western Africa vs Pueblo Male Unemployment Correlation Chart
The statistical analysis conducted on geographies consisting of 356,888,506 people shows a significant positive correlation between the proportion of Immigrants from Western Africa and unemployment rate among males in the United States with a correlation coefficient (R) of 0.629 and weighted average of 6.2%. Similarly, the statistical analysis conducted on geographies consisting of 119,915,032 people shows a mild positive correlation between the proportion of Pueblo and unemployment rate among males in the United States with a correlation coefficient (R) of 0.345 and weighted average of 8.5%, a difference of 36.9%.
Male Unemployment Correlation Summary
| Measurement | Immigrants from Western Africa | Pueblo |
| Minimum | 2.7% | 1.1% |
| Maximum | 20.0% | 37.0% |
| Range | 17.3% | 35.9% |
| Mean | 7.8% | 11.2% |
| Median | 7.0% | 9.3% |
| Interquartile 25% (IQ1) | 5.9% | 5.7% |
| Interquartile 75% (IQ3) | 8.3% | 14.3% |
| Interquartile Range (IQR) | 2.4% | 8.6% |
| Standard Deviation (Sample) | 3.1% | 7.5% |
| Standard Deviation (Population) | 3.1% | 7.4% |
Similar Demographics by Male Unemployment
Demographics Similar to Immigrants from Western Africa by Male Unemployment
In terms of male unemployment, the demographic groups most similar to Immigrants from Western Africa are Ecuadorian (6.2%, a difference of 0.030%), Sierra Leonean (6.2%, a difference of 0.46%), Immigrants from Ghana (6.2%, a difference of 0.53%), Spanish American Indian (6.2%, a difference of 0.65%), and Immigrants from Ecuador (6.2%, a difference of 0.67%).
| Demographics | Rating | Rank | Male Unemployment |
| Tlingit-Haida | 0.0 /100 | #276 | Tragic 6.0% |
| Immigrants | Liberia | 0.0 /100 | #277 | Tragic 6.1% |
| Immigrants | Fiji | 0.0 /100 | #278 | Tragic 6.1% |
| Ghanaians | 0.0 /100 | #279 | Tragic 6.1% |
| Immigrants | Ghana | 0.0 /100 | #280 | Tragic 6.2% |
| Sierra Leoneans | 0.0 /100 | #281 | Tragic 6.2% |
| Ecuadorians | 0.0 /100 | #282 | Tragic 6.2% |
| Immigrants | Western Africa | 0.0 /100 | #283 | Tragic 6.2% |
| Spanish American Indians | 0.0 /100 | #284 | Tragic 6.2% |
| Immigrants | Ecuador | 0.0 /100 | #285 | Tragic 6.2% |
| Africans | 0.0 /100 | #286 | Tragic 6.3% |
| Central American Indians | 0.0 /100 | #287 | Tragic 6.3% |
| Immigrants | Senegal | 0.0 /100 | #288 | Tragic 6.3% |
| Immigrants | Caribbean | 0.0 /100 | #289 | Tragic 6.3% |
| U.S. Virgin Islanders | 0.0 /100 | #290 | Tragic 6.4% |
Demographics Similar to Pueblo by Male Unemployment
In terms of male unemployment, the demographic groups most similar to Pueblo are Tsimshian (8.5%, a difference of 0.060%), Sioux (8.4%, a difference of 1.0%), Yuman (8.6%, a difference of 1.4%), Puerto Rican (8.6%, a difference of 1.4%), and Apache (8.6%, a difference of 1.6%).
| Demographics | Rating | Rank | Male Unemployment |
| Natives/Alaskans | 0.0 /100 | #328 | Tragic 7.7% |
| Immigrants | Yemen | 0.0 /100 | #329 | Tragic 7.8% |
| Yakama | 0.0 /100 | #330 | Tragic 7.9% |
| Alaska Natives | 0.0 /100 | #331 | Tragic 8.1% |
| Pima | 0.0 /100 | #332 | Tragic 8.3% |
| Sioux | 0.0 /100 | #333 | Tragic 8.4% |
| Tsimshian | 0.0 /100 | #334 | Tragic 8.5% |
| Pueblo | 0.0 /100 | #335 | Tragic 8.5% |
| Yuman | 0.0 /100 | #336 | Tragic 8.6% |
| Puerto Ricans | 0.0 /100 | #337 | Tragic 8.6% |
| Apache | 0.0 /100 | #338 | Tragic 8.6% |
| Cheyenne | 0.0 /100 | #339 | Tragic 9.8% |
| Alaskan Athabascans | 0.0 /100 | #340 | Tragic 9.8% |
| Navajo | 0.0 /100 | #341 | Tragic 9.8% |
| Tohono O'odham | 0.0 /100 | #342 | Tragic 10.2% |