Immigrants from West Indies vs Immigrants from Belize Unemployment Among Ages 30 to 34 years
COMPARE
Immigrants from West Indies
Immigrants from Belize
Unemployment Among Ages 30 to 34 years
Unemployment Among Ages 30 to 34 years Comparison
Immigrants from West Indies
Immigrants from Belize
6.4%
UNEMPLOYMENT AMONG AGES 30 TO 34 YEARS
0.0/ 100
METRIC RATING
287th/ 347
METRIC RANK
6.9%
UNEMPLOYMENT AMONG AGES 30 TO 34 YEARS
0.0/ 100
METRIC RATING
307th/ 347
METRIC RANK
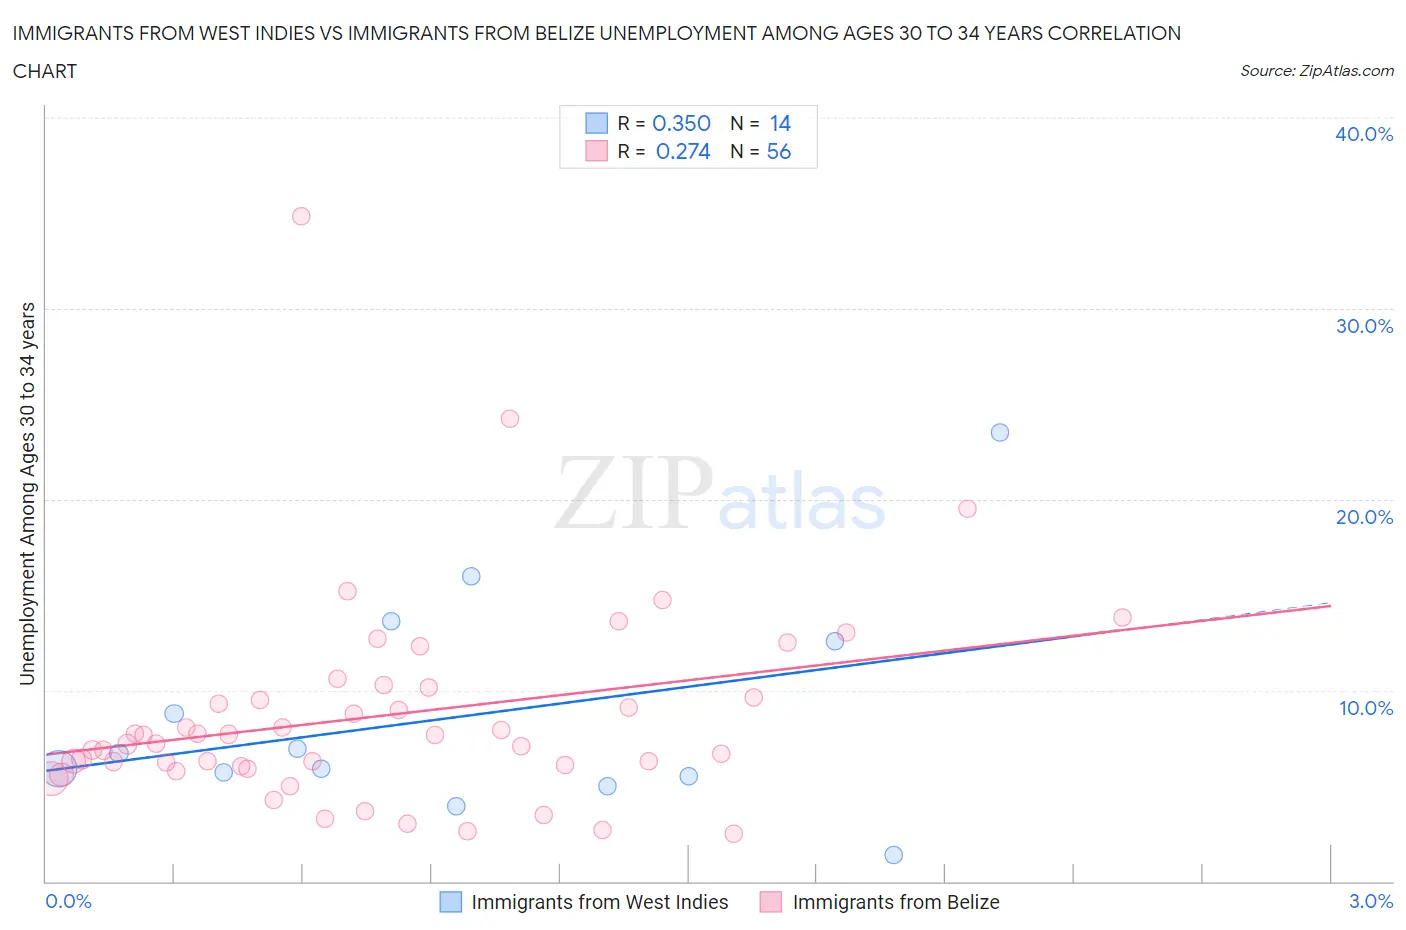
Immigrants from West Indies vs Immigrants from Belize Unemployment Among Ages 30 to 34 years Correlation Chart
The statistical analysis conducted on geographies consisting of 71,825,237 people shows a mild positive correlation between the proportion of Immigrants from West Indies and unemployment rate among population between the ages 30 and 34 in the United States with a correlation coefficient (R) of 0.350 and weighted average of 6.4%. Similarly, the statistical analysis conducted on geographies consisting of 128,396,908 people shows a weak positive correlation between the proportion of Immigrants from Belize and unemployment rate among population between the ages 30 and 34 in the United States with a correlation coefficient (R) of 0.274 and weighted average of 6.9%, a difference of 6.7%.
Unemployment Among Ages 30 to 34 years Correlation Summary
| Measurement | Immigrants from West Indies | Immigrants from Belize |
| Minimum | 1.4% | 2.5% |
| Maximum | 23.5% | 34.8% |
| Range | 22.1% | 32.3% |
| Mean | 8.7% | 8.7% |
| Median | 6.3% | 7.4% |
| Interquartile 25% (IQ1) | 5.5% | 6.0% |
| Interquartile 75% (IQ3) | 12.6% | 9.9% |
| Interquartile Range (IQR) | 7.1% | 3.8% |
| Standard Deviation (Sample) | 5.8% | 5.4% |
| Standard Deviation (Population) | 5.6% | 5.4% |
Demographics Similar to Immigrants from West Indies and Immigrants from Belize by Unemployment Among Ages 30 to 34 years
In terms of unemployment among ages 30 to 34 years, the demographic groups most similar to Immigrants from West Indies are Senegalese (6.4%, a difference of 0.040%), Menominee (6.4%, a difference of 0.080%), Immigrants from Trinidad and Tobago (6.5%, a difference of 0.45%), Jamaican (6.5%, a difference of 0.75%), and Vietnamese (6.5%, a difference of 1.0%). Similarly, the demographic groups most similar to Immigrants from Belize are Immigrants from Armenia (6.8%, a difference of 0.19%), Paiute (6.7%, a difference of 2.4%), Kiowa (6.7%, a difference of 2.5%), Cajun (6.7%, a difference of 2.9%), and Delaware (6.7%, a difference of 3.1%).
| Demographics | Rating | Rank | Unemployment Among Ages 30 to 34 years |
| Immigrants | West Indies | 0.0 /100 | #287 | Tragic 6.4% |
| Senegalese | 0.0 /100 | #288 | Tragic 6.4% |
| Menominee | 0.0 /100 | #289 | Tragic 6.4% |
| Immigrants | Trinidad and Tobago | 0.0 /100 | #290 | Tragic 6.5% |
| Jamaicans | 0.0 /100 | #291 | Tragic 6.5% |
| Vietnamese | 0.0 /100 | #292 | Tragic 6.5% |
| West Indians | 0.0 /100 | #293 | Tragic 6.5% |
| Barbadians | 0.0 /100 | #294 | Tragic 6.5% |
| Trinidadians and Tobagonians | 0.0 /100 | #295 | Tragic 6.5% |
| Immigrants | Jamaica | 0.0 /100 | #296 | Tragic 6.5% |
| Creek | 0.0 /100 | #297 | Tragic 6.6% |
| Immigrants | Barbados | 0.0 /100 | #298 | Tragic 6.6% |
| Dutch West Indians | 0.0 /100 | #299 | Tragic 6.6% |
| Bahamians | 0.0 /100 | #300 | Tragic 6.6% |
| Belizeans | 0.0 /100 | #301 | Tragic 6.6% |
| Delaware | 0.0 /100 | #302 | Tragic 6.7% |
| Cajuns | 0.0 /100 | #303 | Tragic 6.7% |
| Kiowa | 0.0 /100 | #304 | Tragic 6.7% |
| Paiute | 0.0 /100 | #305 | Tragic 6.7% |
| Immigrants | Armenia | 0.0 /100 | #306 | Tragic 6.8% |
| Immigrants | Belize | 0.0 /100 | #307 | Tragic 6.9% |