Immigrants from Vietnam vs Immigrants from Italy Unemployment Among Women with Children Under 6 years
COMPARE
Immigrants from Vietnam
Immigrants from Italy
Unemployment Among Women with Children Under 6 years
Unemployment Among Women with Children Under 6 years Comparison
Immigrants from Vietnam
Immigrants from Italy
6.6%
UNEMPLOYMENT AMONG WOMEN WITH CHILDREN UNDER 6 YEARS
100.0/ 100
METRIC RATING
33rd/ 347
METRIC RANK
7.2%
UNEMPLOYMENT AMONG WOMEN WITH CHILDREN UNDER 6 YEARS
96.1/ 100
METRIC RATING
115th/ 347
METRIC RANK
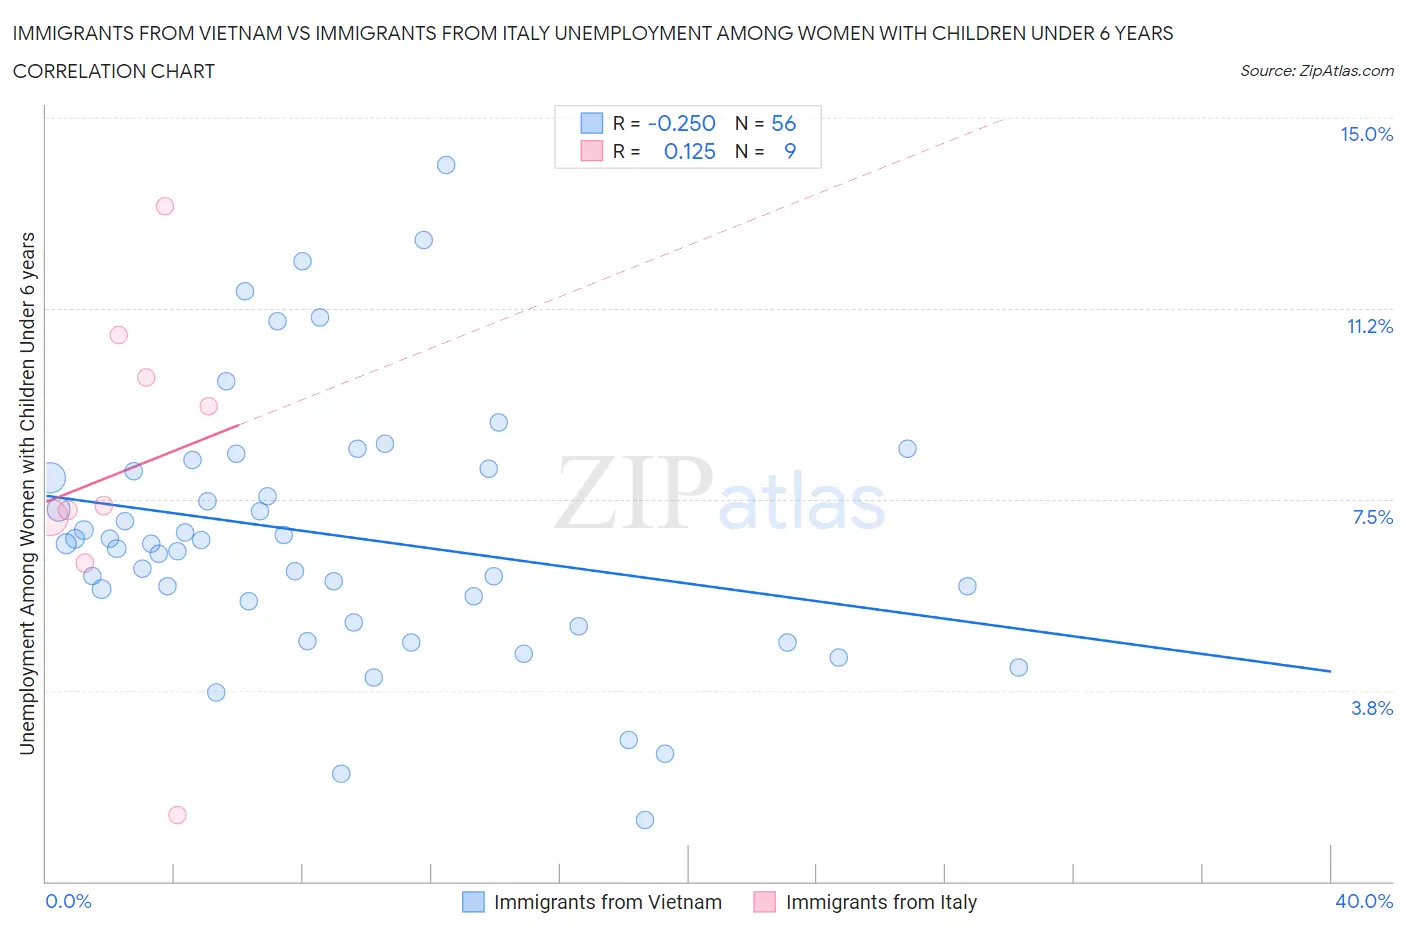
Immigrants from Vietnam vs Immigrants from Italy Unemployment Among Women with Children Under 6 years Correlation Chart
The statistical analysis conducted on geographies consisting of 310,532,392 people shows a weak negative correlation between the proportion of Immigrants from Vietnam and unemployment rate among women with children under the age of 6 in the United States with a correlation coefficient (R) of -0.250 and weighted average of 6.6%. Similarly, the statistical analysis conducted on geographies consisting of 250,790,462 people shows a poor positive correlation between the proportion of Immigrants from Italy and unemployment rate among women with children under the age of 6 in the United States with a correlation coefficient (R) of 0.125 and weighted average of 7.2%, a difference of 9.6%.
Unemployment Among Women with Children Under 6 years Correlation Summary
| Measurement | Immigrants from Vietnam | Immigrants from Italy |
| Minimum | 1.2% | 1.3% |
| Maximum | 14.1% | 13.2% |
| Range | 12.9% | 11.9% |
| Mean | 6.8% | 8.1% |
| Median | 6.6% | 7.4% |
| Interquartile 25% (IQ1) | 5.3% | 6.7% |
| Interquartile 75% (IQ3) | 8.1% | 10.3% |
| Interquartile Range (IQR) | 2.8% | 3.6% |
| Standard Deviation (Sample) | 2.6% | 3.4% |
| Standard Deviation (Population) | 2.5% | 3.2% |
Similar Demographics by Unemployment Among Women with Children Under 6 years
Demographics Similar to Immigrants from Vietnam by Unemployment Among Women with Children Under 6 years
In terms of unemployment among women with children under 6 years, the demographic groups most similar to Immigrants from Vietnam are Immigrants from South Central Asia (6.6%, a difference of 0.010%), Tsimshian (6.6%, a difference of 0.020%), Immigrants from Moldova (6.6%, a difference of 0.080%), Yakama (6.6%, a difference of 0.28%), and Luxembourger (6.6%, a difference of 0.34%).
| Demographics | Rating | Rank | Unemployment Among Women with Children Under 6 years |
| Cypriots | 100.0 /100 | #26 | Exceptional 6.5% |
| Immigrants | Japan | 100.0 /100 | #27 | Exceptional 6.5% |
| Immigrants | Israel | 100.0 /100 | #28 | Exceptional 6.5% |
| Immigrants | Sweden | 100.0 /100 | #29 | Exceptional 6.6% |
| Immigrants | Belarus | 100.0 /100 | #30 | Exceptional 6.6% |
| Immigrants | Moldova | 100.0 /100 | #31 | Exceptional 6.6% |
| Tsimshian | 100.0 /100 | #32 | Exceptional 6.6% |
| Immigrants | Vietnam | 100.0 /100 | #33 | Exceptional 6.6% |
| Immigrants | South Central Asia | 100.0 /100 | #34 | Exceptional 6.6% |
| Yakama | 100.0 /100 | #35 | Exceptional 6.6% |
| Luxembourgers | 100.0 /100 | #36 | Exceptional 6.6% |
| Sri Lankans | 100.0 /100 | #37 | Exceptional 6.6% |
| Hmong | 100.0 /100 | #38 | Exceptional 6.7% |
| Immigrants | Russia | 100.0 /100 | #39 | Exceptional 6.7% |
| Asians | 100.0 /100 | #40 | Exceptional 6.7% |
Demographics Similar to Immigrants from Italy by Unemployment Among Women with Children Under 6 years
In terms of unemployment among women with children under 6 years, the demographic groups most similar to Immigrants from Italy are Argentinean (7.2%, a difference of 0.080%), Armenian (7.2%, a difference of 0.10%), Nicaraguan (7.2%, a difference of 0.12%), Israeli (7.2%, a difference of 0.20%), and Immigrants from Kenya (7.3%, a difference of 0.30%).
| Demographics | Rating | Rank | Unemployment Among Women with Children Under 6 years |
| Eastern Europeans | 96.9 /100 | #108 | Exceptional 7.2% |
| Australians | 96.9 /100 | #109 | Exceptional 7.2% |
| Palestinians | 96.8 /100 | #110 | Exceptional 7.2% |
| Norwegians | 96.7 /100 | #111 | Exceptional 7.2% |
| Israelis | 96.5 /100 | #112 | Exceptional 7.2% |
| Nicaraguans | 96.3 /100 | #113 | Exceptional 7.2% |
| Argentineans | 96.2 /100 | #114 | Exceptional 7.2% |
| Immigrants | Italy | 96.1 /100 | #115 | Exceptional 7.2% |
| Armenians | 95.9 /100 | #116 | Exceptional 7.2% |
| Immigrants | Kenya | 95.4 /100 | #117 | Exceptional 7.3% |
| Serbians | 94.5 /100 | #118 | Exceptional 7.3% |
| South Africans | 94.1 /100 | #119 | Exceptional 7.3% |
| Iraqis | 93.9 /100 | #120 | Exceptional 7.3% |
| Immigrants | Chile | 93.5 /100 | #121 | Exceptional 7.3% |
| Immigrants | Bosnia and Herzegovina | 93.5 /100 | #122 | Exceptional 7.3% |