Immigrants from Vietnam vs Assyrian/Chaldean/Syriac Unemployment Among Ages 60 to 64 years

COMPARE

Immigrants from Vietnam
Race
Ancestry
AfghanAfricanAlaska NativeAlaskan AthabascanAlbanianAleutAlsatianAmericanApacheArabArapahoArgentineanArmenianAustralianAustrianBahamianBangladeshiBarbadianBasqueBelgianBelizeanBermudanBhutaneseBlackfeetBolivianBrazilianBritishBritish West IndianBulgarianBurmeseCajunCambodianCanadianCape VerdeanCarpatho RusynCelticCentral AmericanCentral American IndianCherokeeCheyenneChickasawChileanChineseChippewaChoctawColombianColvilleComancheCosta RicanCreeCreekCroatianCrowCubanCypriotCzechCzechoslovakianDanishDelawareDominicanDutchDutch West IndianEastern EuropeanEcuadorianEgyptianEnglishEstonianEthiopianEuropeanFijianFilipinoFinnishFrenchFrench American IndianFrench CanadianGermanGerman RussianGhanaianGreekGuamanian/ChamorroGuatemalanGuyaneseHaitianHmongHonduranHopiHoumaHungarianIcelanderIndian (Asian)IndonesianInupiatIranianIraqiIrishIroquoisIsraeliItalianJamaicanJapaneseJordanianKenyanKiowaKoreanLaotianLatvianLebaneseLiberianLithuanianLumbeeLuxembourgerMacedonianMalaysianMalteseMarshalleseMenomineeMexicanMexican American IndianMongolianMoroccanNative HawaiianNavajoNepaleseNew ZealanderNicaraguanNigerianNorthern EuropeanNorwegianOkinawanOsageOttawaPaiutePakistaniPalestinianPanamanianParaguayanPennsylvania GermanPeruvianPimaPolishPortuguesePotawatomiPuebloPuerto RicanPuget Sound SalishRomanianRussianSalvadoranSamoanScandinavianScotch-IrishScottishSeminoleSenegaleseSerbianShoshoneSierra LeoneanSiouxSlavicSlovakSloveneSomaliSouth AfricanSouth AmericanSouth American IndianSoviet UnionSpaniardSpanishSpanish AmericanSpanish American IndianSri LankanSubsaharan AfricanSudaneseSwedishSwissSyrianTaiwaneseThaiTlingit-HaidaTohono O'OdhamTonganTrinidadian and TobagonianTsimshianTurkishU.S. Virgin IslanderUgandanUkrainianUruguayanUteVenezuelanVietnameseWelshWest IndianYakamaYaquiYugoslavianYumanYup'ikZimbabwean
Immigration
NonimmigrantsImmigrantsAfghanistanAfricaAlbaniaArgentinaArmeniaAsiaAustraliaAustriaBahamasBangladeshBarbadosBelarusBelgiumBelizeBoliviaBosnia and HerzegovinaBrazilBulgariaBurma/MyanmarCabo VerdeCambodiaCameroonCanadaCaribbeanCentral AmericaChileChinaColombiaCongoCosta RicaCroatiaCubaCzechoslovakiaDenmarkDominicaDominican RepublicEastern AfricaEastern AsiaEastern EuropeEcuadorEgyptEl SalvadorEnglandEritreaEthiopiaEuropeFijiFranceGermanyGhanaGreeceGrenadaGuatemalaGuyanaHaitiHondurasHong KongHungaryIndiaIndonesiaIranIraqIrelandIsraelItalyJamaicaJapanJordanKazakhstanKenyaKoreaKuwaitLaosLatin AmericaLatviaLebanonLiberiaLithuaniaMalaysiaMexicoMicronesiaMiddle AfricaMoldovaMoroccoNepalNetherlandsNicaraguaNigeriaNorth AmericaNorth MacedoniaNorthern AfricaNorthern EuropeNorwayOceaniaPakistanPanamaPeruPhilippinesPolandPortugalRomaniaRussiaSaudi ArabiaScotlandSenegalSerbiaSierra LeoneSingaporeSomaliaSouth AfricaSouth AmericaSouth Central AsiaSouth Eastern AsiaSouthern EuropeSpainSri LankaSt. Vincent and the GrenadinesSudanSwedenSwitzerlandSyriaTaiwanThailandTrinidad and TobagoTurkeyUgandaUkraineUruguayUzbekistanVenezuelaVietnamWest IndiesWestern AfricaWestern AsiaWestern EuropeYemenZaireZimbabweAzores
Assyrian/Chaldean/Syriac
Race
Ancestry
AfghanAfricanAlaska NativeAlaskan AthabascanAlbanianAleutAlsatianAmericanApacheArabArapahoArgentineanArmenianAssyrian/Chaldean/SyriacAustralianAustrianBahamianBangladeshiBarbadianBasqueBelgianBelizeanBermudanBhutaneseBlackfeetBolivianBrazilianBritishBritish West IndianBulgarianBurmeseCajunCambodianCanadianCape VerdeanCarpatho RusynCelticCentral AmericanCentral American IndianCherokeeCheyenneChickasawChileanChineseChippewaChoctawColombianColvilleComancheCosta RicanCreeCreekCroatianCrowCubanCypriotCzechCzechoslovakianDanishDelawareDominicanDutchDutch West IndianEastern EuropeanEcuadorianEgyptianEnglishEstonianEthiopianEuropeanFijianFilipinoFinnishFrenchFrench American IndianFrench CanadianGermanGerman RussianGhanaianGreekGuamanian/ChamorroGuatemalanGuyaneseHaitianHmongHonduranHopiHoumaHungarianIcelanderIndian (Asian)IndonesianInupiatIranianIraqiIrishIroquoisIsraeliItalianJamaicanJapaneseJordanianKenyanKiowaKoreanLaotianLatvianLebaneseLiberianLithuanianLumbeeLuxembourgerMacedonianMalaysianMalteseMarshalleseMenomineeMexicanMexican American IndianMongolianMoroccanNative HawaiianNavajoNepaleseNew ZealanderNicaraguanNigerianNorthern EuropeanNorwegianOkinawanOsageOttawaPaiutePakistaniPalestinianPanamanianParaguayanPennsylvania GermanPeruvianPimaPolishPortuguesePotawatomiPuebloPuerto RicanPuget Sound SalishRomanianRussianSalvadoranSamoanScandinavianScotch-IrishScottishSeminoleSenegaleseSerbianShoshoneSierra LeoneanSiouxSlavicSlovakSloveneSomaliSouth AfricanSouth AmericanSouth American IndianSoviet UnionSpaniardSpanishSpanish AmericanSpanish American IndianSri LankanSubsaharan AfricanSudaneseSwedishSwissSyrianTaiwaneseThaiTlingit-HaidaTohono O'OdhamTonganTrinidadian and TobagonianTsimshianTurkishU.S. Virgin IslanderUgandanUkrainianUruguayanUteVenezuelanVietnameseWelshWest IndianYakamaYaquiYugoslavianYumanYup'ikZimbabwean
Immigration
NonimmigrantsImmigrantsAfghanistanAfricaAlbaniaArgentinaArmeniaAsiaAustraliaAustriaBahamasBangladeshBarbadosBelarusBelgiumBelizeBoliviaBosnia and HerzegovinaBrazilBulgariaBurma/MyanmarCabo VerdeCambodiaCameroonCanadaCaribbeanCentral AmericaChileChinaColombiaCongoCosta RicaCroatiaCubaCzechoslovakiaDenmarkDominicaDominican RepublicEastern AfricaEastern AsiaEastern EuropeEcuadorEgyptEl SalvadorEnglandEritreaEthiopiaEuropeFijiFranceGermanyGhanaGreeceGrenadaGuatemalaGuyanaHaitiHondurasHong KongHungaryIndiaIndonesiaIranIraqIrelandIsraelItalyJamaicaJapanJordanKazakhstanKenyaKoreaKuwaitLaosLatin AmericaLatviaLebanonLiberiaLithuaniaMalaysiaMexicoMicronesiaMiddle AfricaMoldovaMoroccoNepalNetherlandsNicaraguaNigeriaNorth AmericaNorth MacedoniaNorthern AfricaNorthern EuropeNorwayOceaniaPakistanPanamaPeruPhilippinesPolandPortugalRomaniaRussiaSaudi ArabiaScotlandSenegalSerbiaSierra LeoneSingaporeSomaliaSouth AfricaSouth AmericaSouth Central AsiaSouth Eastern AsiaSouthern EuropeSpainSri LankaSt. Vincent and the GrenadinesSudanSwedenSwitzerlandSyriaTaiwanThailandTrinidad and TobagoTurkeyUgandaUkraineUruguayUzbekistanVenezuelaWest IndiesWestern AfricaWestern AsiaWestern EuropeYemenZaireZimbabweAzores
Unemployment Among Ages 60 to 64 years
Income
Poverty
Unemployment
Labor Participation
Family Structure
Vehicle Availability
Education Level
Disability

Unemployment Among Ages 60 to 64 years Comparison

Immigrants from Vietnam

Assyrians/Chaldeans/Syriacs

Fair
Exceptional
4.9%
UNEMPLOYMENT AMONG AGES 60 TO 64 YEARS
23.7/ 100
METRIC RATING
199th/ 347
METRIC RANK
4.5%
UNEMPLOYMENT AMONG AGES 60 TO 64 YEARS
99.9/ 100
METRIC RATING
47th/ 347
METRIC RANK

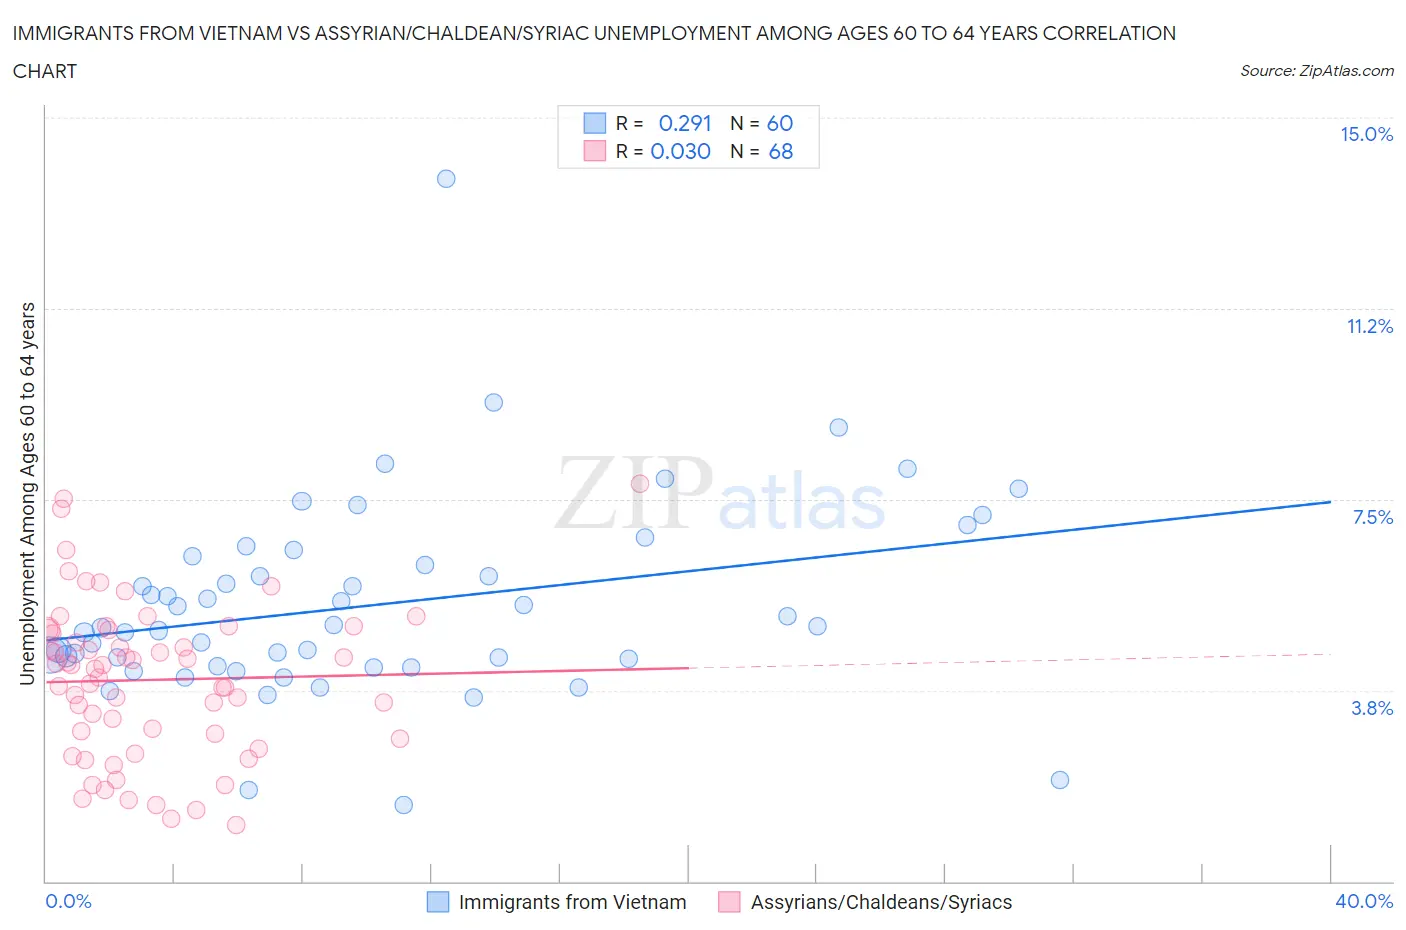
Immigrants from Vietnam vs Assyrian/Chaldean/Syriac Unemployment Among Ages 60 to 64 years Correlation Chart

The statistical analysis conducted on geographies consisting of 368,188,047 people shows a weak positive correlation between the proportion of Immigrants from Vietnam and unemployment rate among population between the ages 60 and 64 in the United States with a correlation coefficient (R) of 0.291 and weighted average of 4.9%. Similarly, the statistical analysis conducted on geographies consisting of 107,458,902 people shows no correlation between the proportion of Assyrians/Chaldeans/Syriacs and unemployment rate among population between the ages 60 and 64 in the United States with a correlation coefficient (R) of 0.030 and weighted average of 4.5%, a difference of 8.0%.
Immigrants from Vietnam vs Assyrian/Chaldean/Syriac Unemployment Among Ages 60 to 64 years

Unemployment Among Ages 60 to 64 years Correlation Summary

MeasurementImmigrants from VietnamAssyrian/Chaldean/Syriac
Minimum1.5%1.1%
Maximum13.8%7.8%
Range12.3%6.7%
Mean5.4%4.0%
Median5.0%4.2%
Interquartile 25% (IQ1)4.3%2.9%
Interquartile 75% (IQ3)6.3%4.9%
Interquartile Range (IQR)2.0%2.1%
Standard Deviation (Sample)1.9%1.5%
Standard Deviation (Population)1.9%1.5%

Similar Demographics by Unemployment Among Ages 60 to 64 years

Demographics Similar to Immigrants from Vietnam by Unemployment Among Ages 60 to 64 years

In terms of unemployment among ages 60 to 64 years, the demographic groups most similar to Immigrants from Vietnam are Guamanian/Chamorro (4.9%, a difference of 0.0%), Immigrants from Czechoslovakia (4.9%, a difference of 0.010%), Colombian (4.9%, a difference of 0.050%), Immigrants from Eastern Europe (4.9%, a difference of 0.070%), and Immigrants from Asia (4.9%, a difference of 0.10%).
DemographicsRating | RankUnemployment Among Ages 60 to 64 years
Menominee
28.8
/100
|
#192
Fair
4.9%
Houma
28.3
/100
|
#193
Fair
4.9%
Immigrants | Colombia
26.8
/100
|
#194
Fair
4.9%
Immigrants | Austria
26.6
/100
|
#195
Fair
4.9%
Immigrants | Asia
25.7
/100
|
#196
Fair
4.9%
Immigrants | Eastern Europe
25.2
/100
|
#197
Fair
4.9%
Guamanians/Chamorros
23.7
/100
|
#198
Fair
4.9%
Immigrants | Vietnam
23.7
/100
|
#199
Fair
4.9%
Immigrants | Czechoslovakia
23.5
/100
|
#200
Fair
4.9%
Colombians
22.7
/100
|
#201
Fair
4.9%
Immigrants | Western Africa
20.6
/100
|
#202
Fair
4.9%
Uruguayans
19.9
/100
|
#203
Poor
4.9%
Russians
18.9
/100
|
#204
Poor
4.9%
Immigrants | Indonesia
17.4
/100
|
#205
Poor
4.9%
New Zealanders
17.4
/100
|
#206
Poor
4.9%

Demographics Similar to Assyrians/Chaldeans/Syriacs by Unemployment Among Ages 60 to 64 years

In terms of unemployment among ages 60 to 64 years, the demographic groups most similar to Assyrians/Chaldeans/Syriacs are Bhutanese (4.5%, a difference of 0.19%), Immigrants from Zimbabwe (4.6%, a difference of 0.22%), Liberian (4.5%, a difference of 0.27%), Scotch-Irish (4.6%, a difference of 0.27%), and Scottish (4.6%, a difference of 0.30%).
DemographicsRating | RankUnemployment Among Ages 60 to 64 years
Scandinavians
100.0
/100
|
#40
Exceptional
4.5%
Immigrants | Sudan
100.0
/100
|
#41
Exceptional
4.5%
English
100.0
/100
|
#42
Exceptional
4.5%
Swedes
100.0
/100
|
#43
Exceptional
4.5%
Europeans
100.0
/100
|
#44
Exceptional
4.5%
Liberians
99.9
/100
|
#45
Exceptional
4.5%
Bhutanese
99.9
/100
|
#46
Exceptional
4.5%
Assyrians/Chaldeans/Syriacs
99.9
/100
|
#47
Exceptional
4.5%
Immigrants | Zimbabwe
99.9
/100
|
#48
Exceptional
4.6%
Scotch-Irish
99.9
/100
|
#49
Exceptional
4.6%
Scottish
99.9
/100
|
#50
Exceptional
4.6%
Immigrants | Kenya
99.9
/100
|
#51
Exceptional
4.6%
Kenyans
99.9
/100
|
#52
Exceptional
4.6%
Immigrants | Moldova
99.9
/100
|
#53
Exceptional
4.6%
Dutch
99.9
/100
|
#54
Exceptional
4.6%