Immigrants from Venezuela vs Yugoslavian Unemployment Among Women with Children Under 18 years

COMPARE

Immigrants from Venezuela
Race
Ancestry
AfghanAfricanAlaska NativeAlaskan AthabascanAlbanianAleutAlsatianAmericanApacheArabArapahoArgentineanArmenianAssyrian/Chaldean/SyriacAustralianAustrianBahamianBangladeshiBarbadianBasqueBelgianBelizeanBermudanBhutaneseBlackfeetBolivianBrazilianBritishBritish West IndianBulgarianBurmeseCajunCambodianCanadianCape VerdeanCarpatho RusynCelticCentral AmericanCentral American IndianCherokeeCheyenneChickasawChileanChineseChippewaChoctawColombianColvilleComancheCosta RicanCreeCreekCroatianCrowCubanCypriotCzechCzechoslovakianDanishDelawareDominicanDutchDutch West IndianEastern EuropeanEcuadorianEgyptianEnglishEstonianEthiopianEuropeanFijianFilipinoFinnishFrenchFrench American IndianFrench CanadianGermanGerman RussianGhanaianGreekGuamanian/ChamorroGuatemalanGuyaneseHaitianHmongHonduranHopiHoumaHungarianIcelanderIndian (Asian)IndonesianInupiatIranianIraqiIrishIroquoisIsraeliItalianJamaicanJapaneseJordanianKenyanKiowaKoreanLaotianLatvianLebaneseLiberianLithuanianLumbeeLuxembourgerMacedonianMalaysianMalteseMarshalleseMenomineeMexicanMexican American IndianMongolianMoroccanNative HawaiianNavajoNepaleseNew ZealanderNicaraguanNigerianNorthern EuropeanNorwegianOkinawanOsageOttawaPaiutePakistaniPalestinianPanamanianParaguayanPennsylvania GermanPeruvianPimaPolishPortuguesePotawatomiPuebloPuerto RicanPuget Sound SalishRomanianRussianSalvadoranSamoanScandinavianScotch-IrishScottishSeminoleSenegaleseSerbianShoshoneSierra LeoneanSiouxSlavicSlovakSloveneSomaliSouth AfricanSouth AmericanSouth American IndianSoviet UnionSpaniardSpanishSpanish AmericanSpanish American IndianSri LankanSubsaharan AfricanSudaneseSwedishSwissSyrianTaiwaneseThaiTlingit-HaidaTohono O'OdhamTonganTrinidadian and TobagonianTsimshianTurkishU.S. Virgin IslanderUgandanUkrainianUruguayanUteVenezuelanVietnameseWelshWest IndianYakamaYaquiYumanYup'ikZimbabwean
Immigration
NonimmigrantsImmigrantsAfghanistanAfricaAlbaniaArgentinaArmeniaAsiaAustraliaAustriaBahamasBangladeshBarbadosBelarusBelgiumBelizeBoliviaBosnia and HerzegovinaBrazilBulgariaBurma/MyanmarCabo VerdeCambodiaCameroonCanadaCaribbeanCentral AmericaChileChinaColombiaCongoCosta RicaCroatiaCubaCzechoslovakiaDenmarkDominicaDominican RepublicEastern AfricaEastern AsiaEastern EuropeEcuadorEgyptEl SalvadorEnglandEritreaEthiopiaEuropeFijiFranceGermanyGhanaGreeceGrenadaGuatemalaGuyanaHaitiHondurasHong KongHungaryIndiaIndonesiaIranIraqIrelandIsraelItalyJamaicaJapanJordanKazakhstanKenyaKoreaKuwaitLaosLatin AmericaLatviaLebanonLiberiaLithuaniaMalaysiaMexicoMicronesiaMiddle AfricaMoldovaMoroccoNepalNetherlandsNicaraguaNigeriaNorth AmericaNorth MacedoniaNorthern AfricaNorthern EuropeNorwayOceaniaPakistanPanamaPeruPhilippinesPolandPortugalRomaniaRussiaSaudi ArabiaScotlandSenegalSerbiaSierra LeoneSingaporeSomaliaSouth AfricaSouth AmericaSouth Central AsiaSouth Eastern AsiaSouthern EuropeSpainSri LankaSt. Vincent and the GrenadinesSudanSwedenSwitzerlandSyriaTaiwanThailandTrinidad and TobagoTurkeyUgandaUkraineUruguayUzbekistanVenezuelaVietnamWest IndiesWestern AfricaWestern AsiaWestern EuropeYemenZaireZimbabweAzores
Yugoslavian
Race
Ancestry
AfghanAfricanAlaska NativeAlaskan AthabascanAlbanianAleutAlsatianAmericanApacheArabArapahoArgentineanArmenianAssyrian/Chaldean/SyriacAustralianAustrianBahamianBangladeshiBarbadianBasqueBelgianBelizeanBermudanBhutaneseBlackfeetBolivianBrazilianBritishBritish West IndianBulgarianBurmeseCajunCambodianCanadianCape VerdeanCarpatho RusynCelticCentral AmericanCentral American IndianCherokeeCheyenneChickasawChileanChineseChippewaChoctawColombianColvilleComancheCosta RicanCreeCreekCroatianCrowCubanCypriotCzechCzechoslovakianDanishDelawareDominicanDutchDutch West IndianEastern EuropeanEcuadorianEgyptianEnglishEstonianEthiopianEuropeanFijianFilipinoFinnishFrenchFrench American IndianFrench CanadianGermanGerman RussianGhanaianGreekGuamanian/ChamorroGuatemalanGuyaneseHaitianHmongHonduranHopiHoumaHungarianIcelanderIndian (Asian)IndonesianInupiatIranianIraqiIrishIroquoisIsraeliItalianJamaicanJapaneseJordanianKenyanKiowaKoreanLaotianLatvianLebaneseLiberianLithuanianLumbeeLuxembourgerMacedonianMalaysianMalteseMarshalleseMenomineeMexicanMexican American IndianMongolianMoroccanNative HawaiianNavajoNepaleseNew ZealanderNicaraguanNigerianNorthern EuropeanNorwegianOkinawanOsageOttawaPaiutePakistaniPalestinianPanamanianParaguayanPennsylvania GermanPeruvianPimaPolishPortuguesePotawatomiPuebloPuerto RicanPuget Sound SalishRomanianRussianSalvadoranSamoanScandinavianScotch-IrishScottishSeminoleSenegaleseSerbianShoshoneSierra LeoneanSiouxSlavicSlovakSloveneSomaliSouth AfricanSouth AmericanSouth American IndianSoviet UnionSpaniardSpanishSpanish AmericanSpanish American IndianSri LankanSubsaharan AfricanSudaneseSwedishSwissSyrianTaiwaneseThaiTlingit-HaidaTohono O'OdhamTonganTrinidadian and TobagonianTsimshianTurkishU.S. Virgin IslanderUgandanUkrainianUruguayanUteVenezuelanVietnameseWelshWest IndianYakamaYaquiYugoslavianYumanYup'ikZimbabwean
Immigration
NonimmigrantsImmigrantsAfghanistanAfricaAlbaniaArgentinaArmeniaAsiaAustraliaAustriaBahamasBangladeshBarbadosBelarusBelgiumBelizeBoliviaBosnia and HerzegovinaBrazilBulgariaBurma/MyanmarCabo VerdeCambodiaCameroonCanadaCaribbeanCentral AmericaChileChinaColombiaCongoCosta RicaCroatiaCubaCzechoslovakiaDenmarkDominicaDominican RepublicEastern AfricaEastern AsiaEastern EuropeEcuadorEgyptEl SalvadorEnglandEritreaEthiopiaEuropeFijiFranceGermanyGhanaGreeceGrenadaGuatemalaGuyanaHaitiHondurasHong KongHungaryIndiaIndonesiaIranIraqIrelandIsraelItalyJamaicaJapanJordanKazakhstanKenyaKoreaKuwaitLaosLatin AmericaLatviaLebanonLiberiaLithuaniaMalaysiaMexicoMicronesiaMiddle AfricaMoldovaMoroccoNepalNetherlandsNicaraguaNigeriaNorth AmericaNorth MacedoniaNorthern AfricaNorthern EuropeNorwayOceaniaPakistanPanamaPeruPhilippinesPolandPortugalRomaniaRussiaSaudi ArabiaScotlandSenegalSerbiaSierra LeoneSingaporeSomaliaSouth AfricaSouth AmericaSouth Central AsiaSouth Eastern AsiaSouthern EuropeSpainSri LankaSt. Vincent and the GrenadinesSudanSwedenSwitzerlandSyriaTaiwanThailandTrinidad and TobagoTurkeyUgandaUkraineUruguayUzbekistanVietnamWest IndiesWestern AfricaWestern AsiaWestern EuropeYemenZaireZimbabweAzores
Unemployment Among Women with Children Under 18 years
Income
Poverty
Unemployment
Labor Participation
Family Structure
Vehicle Availability
Education Level
Disability

Unemployment Among Women with Children Under 18 years Comparison

Immigrants from Venezuela

Yugoslavians

Good
Exceptional
5.3%
UNEMPLOYMENT AMONG WOMEN WITH CHILDREN UNDER 18 YEARS
75.4/ 100
METRIC RATING
142nd/ 347
METRIC RANK
5.1%
UNEMPLOYMENT AMONG WOMEN WITH CHILDREN UNDER 18 YEARS
98.3/ 100
METRIC RATING
51st/ 347
METRIC RANK

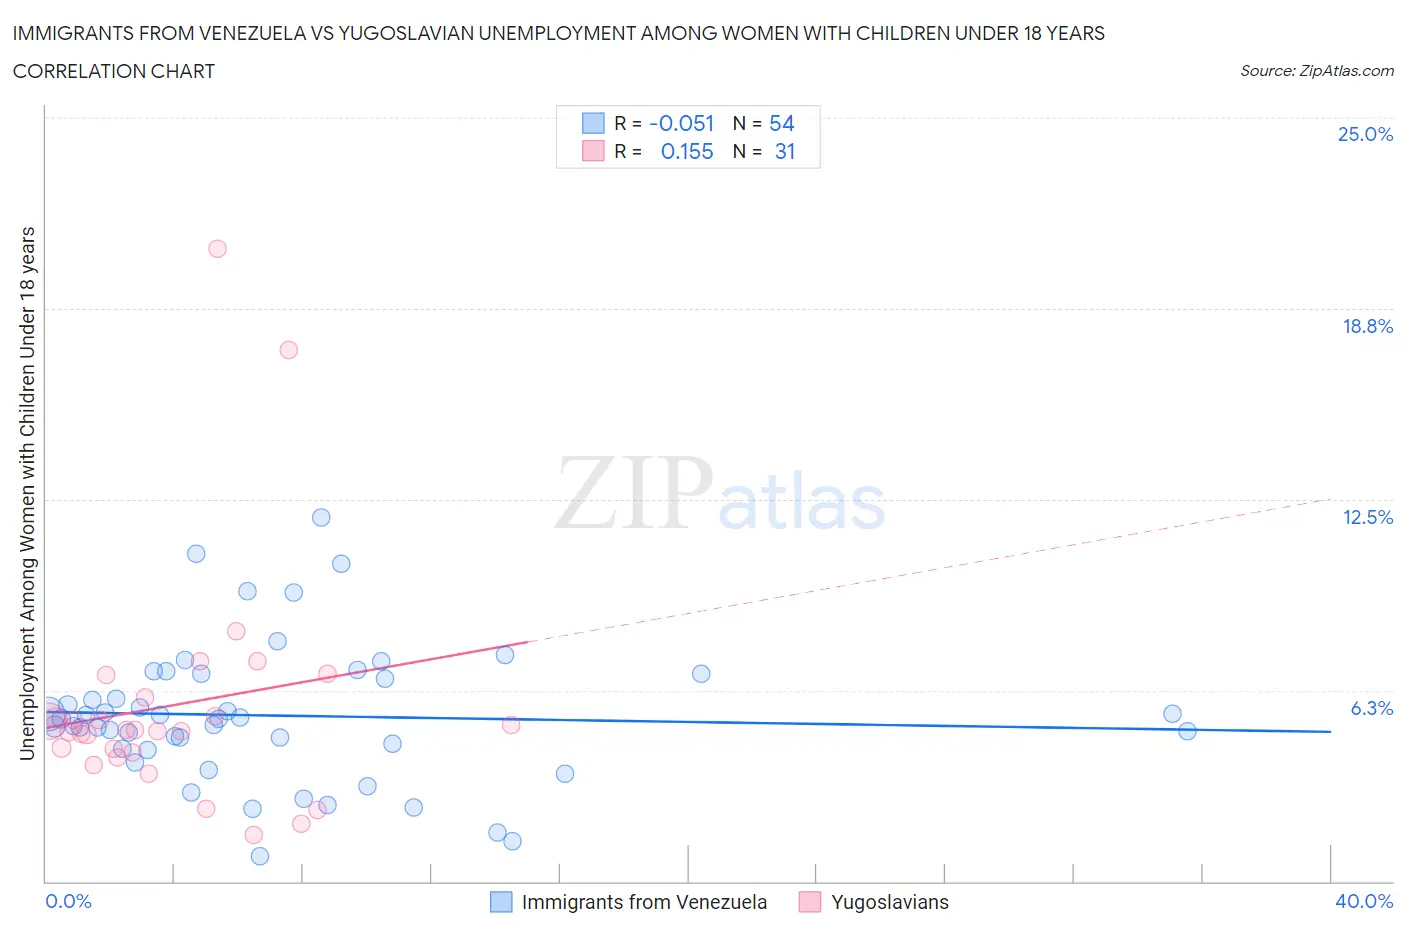
Immigrants from Venezuela vs Yugoslavian Unemployment Among Women with Children Under 18 years Correlation Chart

The statistical analysis conducted on geographies consisting of 281,551,920 people shows a slight negative correlation between the proportion of Immigrants from Venezuela and unemployment rate among women with children under the age of 18 in the United States with a correlation coefficient (R) of -0.051 and weighted average of 5.3%. Similarly, the statistical analysis conducted on geographies consisting of 276,335,631 people shows a poor positive correlation between the proportion of Yugoslavians and unemployment rate among women with children under the age of 18 in the United States with a correlation coefficient (R) of 0.155 and weighted average of 5.1%, a difference of 5.6%.
Immigrants from Venezuela vs Yugoslavian Unemployment Among Women with Children Under 18 years

Unemployment Among Women with Children Under 18 years Correlation Summary

MeasurementImmigrants from VenezuelaYugoslavian
Minimum0.80%1.5%
Maximum11.9%20.7%
Range11.1%19.2%
Mean5.4%5.8%
Median5.3%4.9%
Interquartile 25% (IQ1)4.4%4.2%
Interquartile 75% (IQ3)6.8%6.0%
Interquartile Range (IQR)2.4%1.8%
Standard Deviation (Sample)2.3%3.9%
Standard Deviation (Population)2.2%3.8%

Similar Demographics by Unemployment Among Women with Children Under 18 years

Demographics Similar to Immigrants from Venezuela by Unemployment Among Women with Children Under 18 years

In terms of unemployment among women with children under 18 years, the demographic groups most similar to Immigrants from Venezuela are Chilean (5.3%, a difference of 0.040%), Immigrants from England (5.3%, a difference of 0.050%), Venezuelan (5.3%, a difference of 0.060%), Immigrants from Norway (5.3%, a difference of 0.080%), and Immigrants from Egypt (5.3%, a difference of 0.14%).
DemographicsRating | RankUnemployment Among Women with Children Under 18 years
New Zealanders
79.9
/100
|
#135
Good
5.3%
Immigrants | Jordan
79.5
/100
|
#136
Good
5.3%
Jordanians
78.8
/100
|
#137
Good
5.3%
Argentineans
78.8
/100
|
#138
Good
5.3%
Immigrants | Ukraine
78.5
/100
|
#139
Good
5.3%
Immigrants | Norway
76.2
/100
|
#140
Good
5.3%
Venezuelans
76.0
/100
|
#141
Good
5.3%
Immigrants | Venezuela
75.4
/100
|
#142
Good
5.3%
Chileans
75.0
/100
|
#143
Good
5.3%
Immigrants | England
74.9
/100
|
#144
Good
5.3%
Immigrants | Egypt
74.0
/100
|
#145
Good
5.3%
Immigrants | Belarus
73.4
/100
|
#146
Good
5.3%
Bangladeshis
73.2
/100
|
#147
Good
5.3%
Immigrants | Western Europe
72.8
/100
|
#148
Good
5.4%
Immigrants | Kenya
72.2
/100
|
#149
Good
5.4%

Demographics Similar to Yugoslavians by Unemployment Among Women with Children Under 18 years

In terms of unemployment among women with children under 18 years, the demographic groups most similar to Yugoslavians are Immigrants from Nepal (5.1%, a difference of 0.0%), Immigrants from Japan (5.0%, a difference of 0.080%), Scottish (5.1%, a difference of 0.090%), Lithuanian (5.0%, a difference of 0.11%), and Immigrants from Serbia (5.1%, a difference of 0.12%).
DemographicsRating | RankUnemployment Among Women with Children Under 18 years
Immigrants | Moldova
98.9
/100
|
#44
Exceptional
5.0%
Immigrants | Malaysia
98.8
/100
|
#45
Exceptional
5.0%
Immigrants | Korea
98.7
/100
|
#46
Exceptional
5.0%
British
98.7
/100
|
#47
Exceptional
5.0%
Northern Europeans
98.6
/100
|
#48
Exceptional
5.0%
Lithuanians
98.4
/100
|
#49
Exceptional
5.0%
Immigrants | Japan
98.4
/100
|
#50
Exceptional
5.0%
Yugoslavians
98.3
/100
|
#51
Exceptional
5.1%
Immigrants | Nepal
98.3
/100
|
#52
Exceptional
5.1%
Scottish
98.2
/100
|
#53
Exceptional
5.1%
Immigrants | Serbia
98.2
/100
|
#54
Exceptional
5.1%
Immigrants | Sri Lanka
98.1
/100
|
#55
Exceptional
5.1%
Immigrants | Ireland
98.0
/100
|
#56
Exceptional
5.1%
Czechoslovakians
98.0
/100
|
#57
Exceptional
5.1%
Immigrants | Belgium
97.9
/100
|
#58
Exceptional
5.1%