Immigrants from Uruguay vs Menominee Unemployment Among Ages 30 to 34 years

COMPARE

Immigrants from Uruguay
Race
Ancestry
AfghanAfricanAlaska NativeAlaskan AthabascanAlbanianAleutAlsatianAmericanApacheArabArapahoArgentineanArmenianAssyrian/Chaldean/SyriacAustralianAustrianBahamianBangladeshiBarbadianBasqueBelgianBelizeanBermudanBhutaneseBlackfeetBolivianBrazilianBritishBritish West IndianBulgarianBurmeseCajunCambodianCanadianCape VerdeanCarpatho RusynCelticCentral AmericanCentral American IndianCherokeeCheyenneChickasawChileanChineseChippewaChoctawColombianColvilleComancheCosta RicanCreeCreekCroatianCrowCubanCypriotCzechCzechoslovakianDanishDelawareDominicanDutchDutch West IndianEastern EuropeanEcuadorianEgyptianEnglishEstonianEthiopianEuropeanFijianFilipinoFinnishFrenchFrench American IndianFrench CanadianGermanGerman RussianGhanaianGreekGuamanian/ChamorroGuatemalanGuyaneseHaitianHmongHonduranHopiHoumaHungarianIcelanderIndian (Asian)IndonesianInupiatIranianIraqiIrishIroquoisIsraeliItalianJamaicanJapaneseJordanianKenyanKiowaKoreanLaotianLatvianLebaneseLiberianLithuanianLumbeeLuxembourgerMacedonianMalaysianMalteseMarshalleseMexicanMexican American IndianMongolianMoroccanNative HawaiianNavajoNepaleseNew ZealanderNicaraguanNigerianNorthern EuropeanNorwegianOkinawanOsageOttawaPaiutePakistaniPalestinianPanamanianParaguayanPennsylvania GermanPeruvianPimaPolishPortuguesePotawatomiPuebloPuerto RicanPuget Sound SalishRomanianRussianSalvadoranSamoanScandinavianScotch-IrishScottishSeminoleSenegaleseSerbianShoshoneSierra LeoneanSiouxSlavicSlovakSloveneSomaliSouth AfricanSouth AmericanSouth American IndianSoviet UnionSpaniardSpanishSpanish AmericanSpanish American IndianSri LankanSubsaharan AfricanSudaneseSwedishSwissSyrianTaiwaneseThaiTlingit-HaidaTohono O'OdhamTonganTrinidadian and TobagonianTsimshianTurkishU.S. Virgin IslanderUgandanUkrainianUruguayanUteVenezuelanVietnameseWelshWest IndianYakamaYaquiYugoslavianYumanYup'ikZimbabwean
Immigration
NonimmigrantsImmigrantsAfghanistanAfricaAlbaniaArgentinaArmeniaAsiaAustraliaAustriaBahamasBangladeshBarbadosBelarusBelgiumBelizeBoliviaBosnia and HerzegovinaBrazilBulgariaBurma/MyanmarCabo VerdeCambodiaCameroonCanadaCaribbeanCentral AmericaChileChinaColombiaCongoCosta RicaCroatiaCubaCzechoslovakiaDenmarkDominicaDominican RepublicEastern AfricaEastern AsiaEastern EuropeEcuadorEgyptEl SalvadorEnglandEritreaEthiopiaEuropeFijiFranceGermanyGhanaGreeceGrenadaGuatemalaGuyanaHaitiHondurasHong KongHungaryIndiaIndonesiaIranIraqIrelandIsraelItalyJamaicaJapanJordanKazakhstanKenyaKoreaKuwaitLaosLatin AmericaLatviaLebanonLiberiaLithuaniaMalaysiaMexicoMicronesiaMiddle AfricaMoldovaMoroccoNepalNetherlandsNicaraguaNigeriaNorth AmericaNorth MacedoniaNorthern AfricaNorthern EuropeNorwayOceaniaPakistanPanamaPeruPhilippinesPolandPortugalRomaniaRussiaSaudi ArabiaScotlandSenegalSerbiaSierra LeoneSingaporeSomaliaSouth AfricaSouth AmericaSouth Central AsiaSouth Eastern AsiaSouthern EuropeSpainSri LankaSt. Vincent and the GrenadinesSudanSwedenSwitzerlandSyriaTaiwanThailandTrinidad and TobagoTurkeyUgandaUkraineUruguayUzbekistanVenezuelaVietnamWest IndiesWestern AfricaWestern AsiaWestern EuropeYemenZaireZimbabweAzores
Menominee
Race
Ancestry
AfghanAfricanAlaska NativeAlaskan AthabascanAlbanianAleutAlsatianAmericanApacheArabArapahoArgentineanArmenianAssyrian/Chaldean/SyriacAustralianAustrianBahamianBangladeshiBarbadianBasqueBelgianBelizeanBermudanBhutaneseBlackfeetBolivianBrazilianBritishBritish West IndianBulgarianBurmeseCajunCambodianCanadianCape VerdeanCarpatho RusynCelticCentral AmericanCentral American IndianCherokeeCheyenneChickasawChileanChineseChippewaChoctawColombianColvilleComancheCosta RicanCreeCreekCroatianCrowCubanCypriotCzechCzechoslovakianDanishDelawareDominicanDutchDutch West IndianEastern EuropeanEcuadorianEgyptianEnglishEstonianEthiopianEuropeanFijianFilipinoFinnishFrenchFrench American IndianFrench CanadianGermanGerman RussianGhanaianGreekGuamanian/ChamorroGuatemalanGuyaneseHaitianHmongHonduranHopiHoumaHungarianIcelanderIndian (Asian)IndonesianInupiatIranianIraqiIrishIroquoisIsraeliItalianJamaicanJapaneseJordanianKenyanKiowaKoreanLaotianLatvianLebaneseLiberianLithuanianLumbeeLuxembourgerMacedonianMalaysianMalteseMarshalleseMenomineeMexicanMexican American IndianMongolianMoroccanNative HawaiianNavajoNepaleseNew ZealanderNicaraguanNigerianNorthern EuropeanNorwegianOkinawanOsageOttawaPaiutePakistaniPalestinianPanamanianParaguayanPennsylvania GermanPeruvianPimaPolishPortuguesePotawatomiPuebloPuerto RicanPuget Sound SalishRomanianRussianSalvadoranSamoanScandinavianScotch-IrishScottishSeminoleSenegaleseSerbianShoshoneSierra LeoneanSiouxSlavicSlovakSloveneSomaliSouth AfricanSouth AmericanSouth American IndianSoviet UnionSpaniardSpanishSpanish AmericanSpanish American IndianSri LankanSubsaharan AfricanSudaneseSwedishSwissSyrianTaiwaneseThaiTlingit-HaidaTohono O'OdhamTonganTrinidadian and TobagonianTsimshianTurkishU.S. Virgin IslanderUgandanUkrainianUruguayanUteVenezuelanVietnameseWelshWest IndianYakamaYaquiYugoslavianYumanYup'ikZimbabwean
Immigration
NonimmigrantsImmigrantsAfghanistanAfricaAlbaniaArgentinaArmeniaAsiaAustraliaAustriaBahamasBangladeshBarbadosBelarusBelgiumBelizeBoliviaBosnia and HerzegovinaBrazilBulgariaBurma/MyanmarCabo VerdeCambodiaCameroonCanadaCaribbeanCentral AmericaChileChinaColombiaCongoCosta RicaCroatiaCubaCzechoslovakiaDenmarkDominicaDominican RepublicEastern AfricaEastern AsiaEastern EuropeEcuadorEgyptEl SalvadorEnglandEritreaEthiopiaEuropeFijiFranceGermanyGhanaGreeceGrenadaGuatemalaGuyanaHaitiHondurasHong KongHungaryIndiaIndonesiaIranIraqIrelandIsraelItalyJamaicaJapanJordanKazakhstanKenyaKoreaKuwaitLaosLatin AmericaLatviaLebanonLiberiaLithuaniaMalaysiaMexicoMicronesiaMiddle AfricaMoldovaMoroccoNepalNetherlandsNicaraguaNigeriaNorth AmericaNorth MacedoniaNorthern AfricaNorthern EuropeNorwayOceaniaPakistanPanamaPeruPhilippinesPolandPortugalRomaniaRussiaSaudi ArabiaScotlandSenegalSerbiaSierra LeoneSingaporeSomaliaSouth AfricaSouth AmericaSouth Central AsiaSouth Eastern AsiaSouthern EuropeSpainSri LankaSt. Vincent and the GrenadinesSudanSwedenSwitzerlandSyriaTaiwanThailandTrinidad and TobagoTurkeyUgandaUkraineUzbekistanVenezuelaVietnamWest IndiesWestern AfricaWestern AsiaWestern EuropeYemenZaireZimbabweAzores
Unemployment Among Ages 30 to 34 years
Income
Poverty
Unemployment
Labor Participation
Family Structure
Vehicle Availability
Education Level
Disability

Unemployment Among Ages 30 to 34 years Comparison

Immigrants from Uruguay

Menominee

Good
Tragic
5.3%
UNEMPLOYMENT AMONG AGES 30 TO 34 YEARS
79.3/ 100
METRIC RATING
128th/ 347
METRIC RANK
6.4%
UNEMPLOYMENT AMONG AGES 30 TO 34 YEARS
0.0/ 100
METRIC RATING
289th/ 347
METRIC RANK

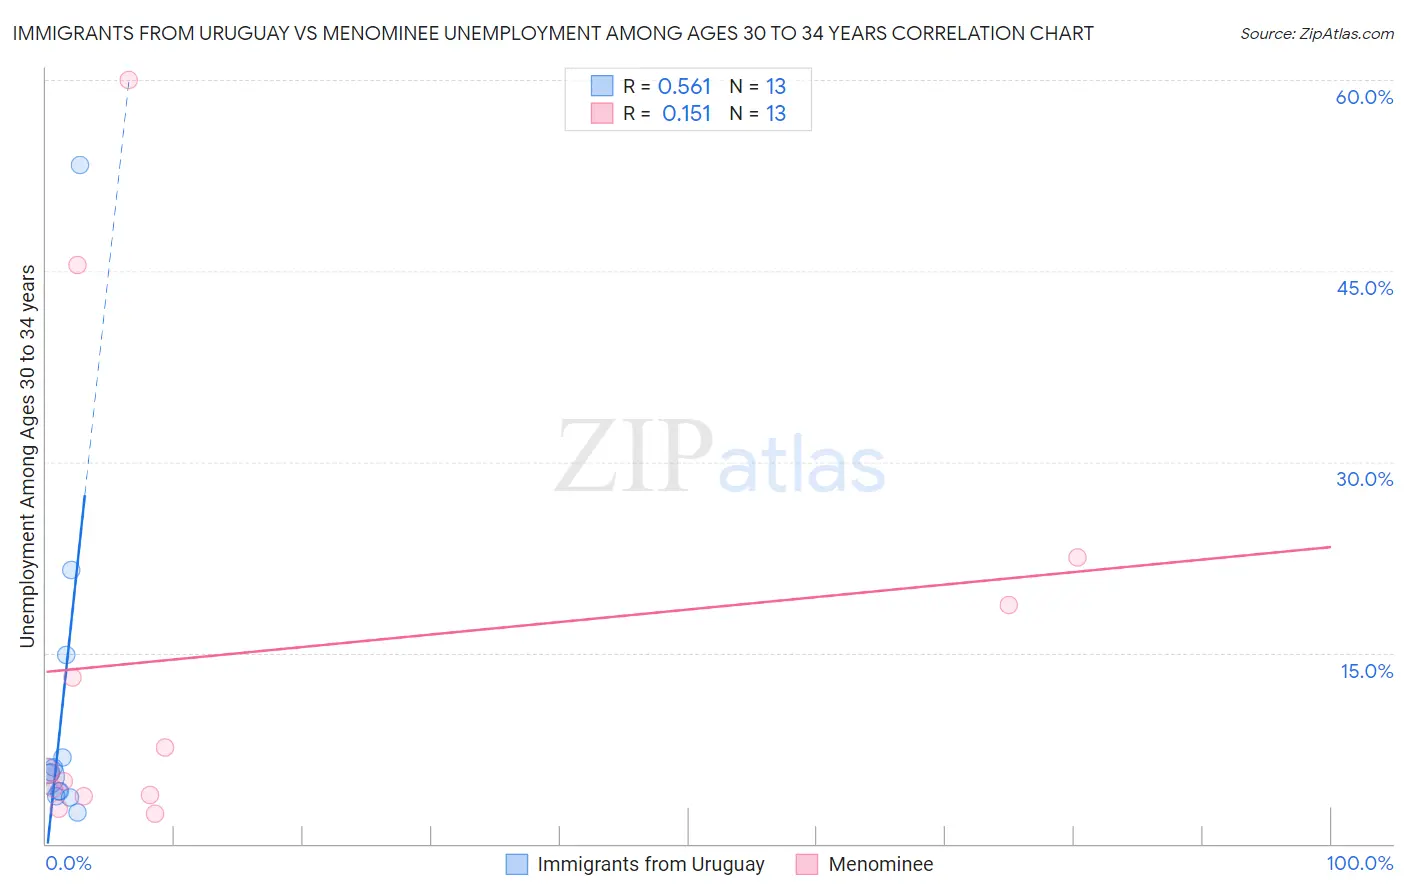
Immigrants from Uruguay vs Menominee Unemployment Among Ages 30 to 34 years Correlation Chart

The statistical analysis conducted on geographies consisting of 130,935,949 people shows a substantial positive correlation between the proportion of Immigrants from Uruguay and unemployment rate among population between the ages 30 and 34 in the United States with a correlation coefficient (R) of 0.561 and weighted average of 5.3%. Similarly, the statistical analysis conducted on geographies consisting of 44,912,548 people shows a poor positive correlation between the proportion of Menominee and unemployment rate among population between the ages 30 and 34 in the United States with a correlation coefficient (R) of 0.151 and weighted average of 6.4%, a difference of 20.7%.
Immigrants from Uruguay vs Menominee Unemployment Among Ages 30 to 34 years

Unemployment Among Ages 30 to 34 years Correlation Summary

MeasurementImmigrants from UruguayMenominee
Minimum2.5%2.4%
Maximum53.3%60.0%
Range50.8%57.6%
Mean10.5%15.0%
Median5.5%5.7%
Interquartile 25% (IQ1)3.9%3.7%
Interquartile 75% (IQ3)10.8%20.6%
Interquartile Range (IQR)6.9%16.9%
Standard Deviation (Sample)13.9%18.1%
Standard Deviation (Population)13.4%17.4%

Similar Demographics by Unemployment Among Ages 30 to 34 years

Demographics Similar to Immigrants from Uruguay by Unemployment Among Ages 30 to 34 years

In terms of unemployment among ages 30 to 34 years, the demographic groups most similar to Immigrants from Uruguay are Taiwanese (5.3%, a difference of 0.020%), Polish (5.3%, a difference of 0.060%), Immigrants from Sri Lanka (5.3%, a difference of 0.10%), Greek (5.3%, a difference of 0.12%), and German (5.3%, a difference of 0.16%).
DemographicsRating | RankUnemployment Among Ages 30 to 34 years
Romanians
82.3
/100
|
#121
Excellent
5.3%
Immigrants | Netherlands
81.8
/100
|
#122
Excellent
5.3%
Immigrants | Italy
81.1
/100
|
#123
Excellent
5.3%
Immigrants | Brazil
80.8
/100
|
#124
Excellent
5.3%
Greeks
80.4
/100
|
#125
Excellent
5.3%
Immigrants | Sri Lanka
80.2
/100
|
#126
Excellent
5.3%
Taiwanese
79.4
/100
|
#127
Good
5.3%
Immigrants | Uruguay
79.3
/100
|
#128
Good
5.3%
Poles
78.8
/100
|
#129
Good
5.3%
Germans
77.8
/100
|
#130
Good
5.3%
Immigrants | Eastern Europe
77.4
/100
|
#131
Good
5.3%
Carpatho Rusyns
77.3
/100
|
#132
Good
5.3%
Immigrants | Northern Europe
77.3
/100
|
#133
Good
5.3%
Bangladeshis
76.6
/100
|
#134
Good
5.3%
Palestinians
75.1
/100
|
#135
Good
5.4%

Demographics Similar to Menominee by Unemployment Among Ages 30 to 34 years

In terms of unemployment among ages 30 to 34 years, the demographic groups most similar to Menominee are Senegalese (6.4%, a difference of 0.040%), Immigrants from West Indies (6.4%, a difference of 0.080%), Central American Indian (6.4%, a difference of 0.10%), Choctaw (6.4%, a difference of 0.14%), and Immigrants from Bangladesh (6.4%, a difference of 0.25%).
DemographicsRating | RankUnemployment Among Ages 30 to 34 years
Africans
0.0
/100
|
#282
Tragic
6.4%
Hispanics or Latinos
0.0
/100
|
#283
Tragic
6.4%
Immigrants | Bangladesh
0.0
/100
|
#284
Tragic
6.4%
Choctaw
0.0
/100
|
#285
Tragic
6.4%
Central American Indians
0.0
/100
|
#286
Tragic
6.4%
Immigrants | West Indies
0.0
/100
|
#287
Tragic
6.4%
Senegalese
0.0
/100
|
#288
Tragic
6.4%
Menominee
0.0
/100
|
#289
Tragic
6.4%
Immigrants | Trinidad and Tobago
0.0
/100
|
#290
Tragic
6.5%
Jamaicans
0.0
/100
|
#291
Tragic
6.5%
Vietnamese
0.0
/100
|
#292
Tragic
6.5%
West Indians
0.0
/100
|
#293
Tragic
6.5%
Barbadians
0.0
/100
|
#294
Tragic
6.5%
Trinidadians and Tobagonians
0.0
/100
|
#295
Tragic
6.5%
Immigrants | Jamaica
0.0
/100
|
#296
Tragic
6.5%