Immigrants from Turkey vs Yup'ik Unemployment Among Ages 16 to 19 years
COMPARE
Immigrants from Turkey
Yup'ik
Unemployment Among Ages 16 to 19 years
Unemployment Among Ages 16 to 19 years Comparison
Immigrants from Turkey
Yup'ik
17.6%
UNEMPLOYMENT AMONG AGES 16 TO 19 YEARS
45.6/ 100
METRIC RATING
181st/ 347
METRIC RANK
41.0%
UNEMPLOYMENT AMONG AGES 16 TO 19 YEARS
0.0/ 100
METRIC RATING
347th/ 347
METRIC RANK
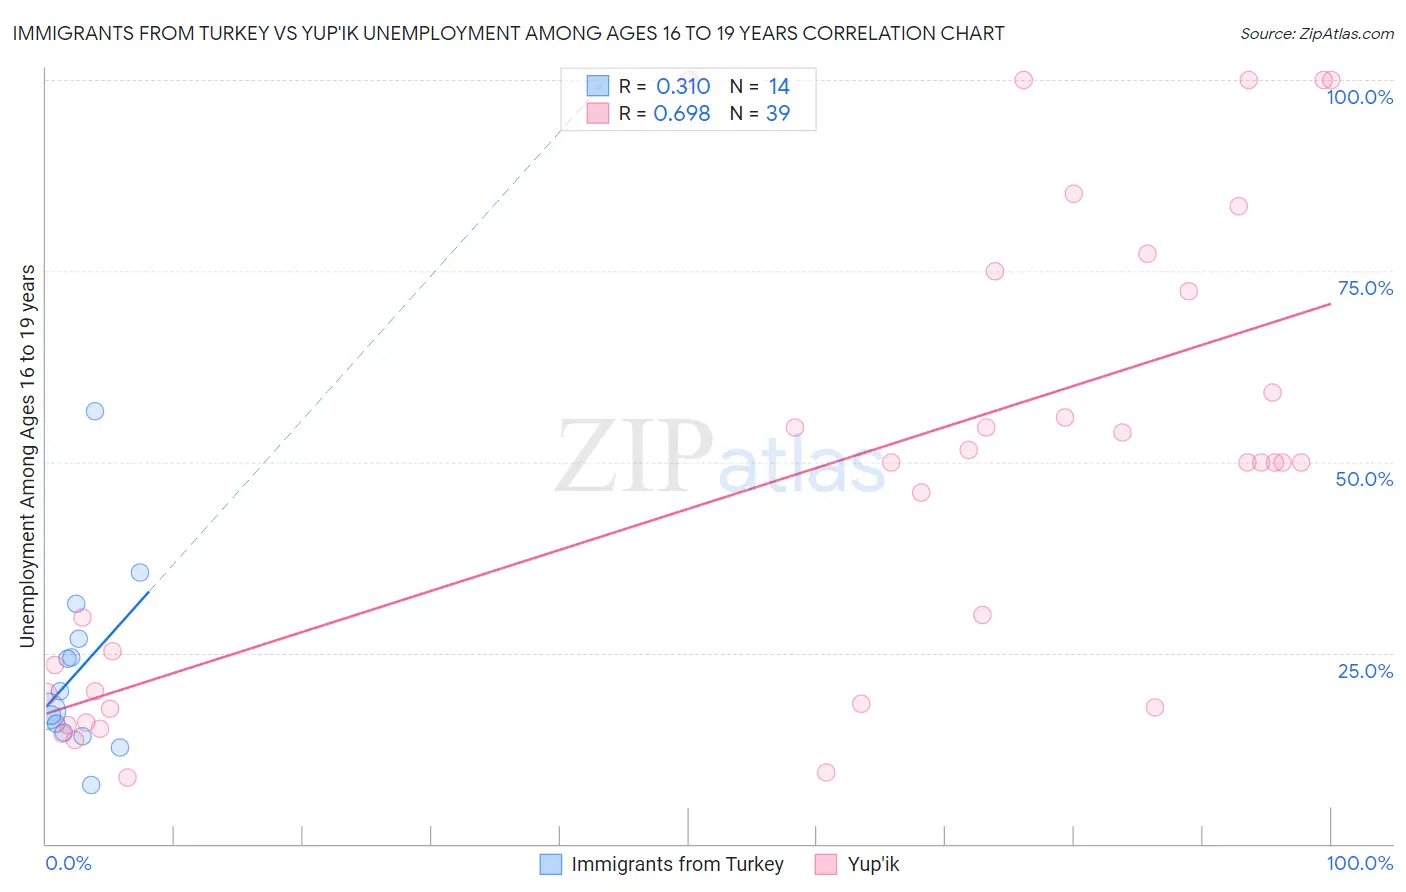
Immigrants from Turkey vs Yup'ik Unemployment Among Ages 16 to 19 years Correlation Chart
The statistical analysis conducted on geographies consisting of 215,488,732 people shows a mild positive correlation between the proportion of Immigrants from Turkey and unemployment rate among population between the ages 16 and 19 in the United States with a correlation coefficient (R) of 0.310 and weighted average of 17.6%. Similarly, the statistical analysis conducted on geographies consisting of 39,366,389 people shows a significant positive correlation between the proportion of Yup'ik and unemployment rate among population between the ages 16 and 19 in the United States with a correlation coefficient (R) of 0.698 and weighted average of 41.0%, a difference of 132.6%.
Unemployment Among Ages 16 to 19 years Correlation Summary
| Measurement | Immigrants from Turkey | Yup'ik |
| Minimum | 7.7% | 8.7% |
| Maximum | 56.7% | 100.0% |
| Range | 49.0% | 91.3% |
| Mean | 22.7% | 47.8% |
| Median | 18.7% | 50.0% |
| Interquartile 25% (IQ1) | 14.5% | 18.4% |
| Interquartile 75% (IQ3) | 26.8% | 72.3% |
| Interquartile Range (IQR) | 12.3% | 53.9% |
| Standard Deviation (Sample) | 12.4% | 29.6% |
| Standard Deviation (Population) | 12.0% | 29.2% |
Similar Demographics by Unemployment Among Ages 16 to 19 years
Demographics Similar to Immigrants from Turkey by Unemployment Among Ages 16 to 19 years
In terms of unemployment among ages 16 to 19 years, the demographic groups most similar to Immigrants from Turkey are Russian (17.6%, a difference of 0.020%), Immigrants from Uruguay (17.6%, a difference of 0.050%), Eastern European (17.6%, a difference of 0.060%), Spaniard (17.6%, a difference of 0.070%), and American (17.6%, a difference of 0.090%).
| Demographics | Rating | Rank | Unemployment Among Ages 16 to 19 years |
| Osage | 50.0 /100 | #174 | Average 17.6% |
| Immigrants | Sweden | 49.1 /100 | #175 | Average 17.6% |
| Nicaraguans | 48.9 /100 | #176 | Average 17.6% |
| Bermudans | 48.7 /100 | #177 | Average 17.6% |
| Celtics | 48.7 /100 | #178 | Average 17.6% |
| Americans | 47.4 /100 | #179 | Average 17.6% |
| Spaniards | 47.1 /100 | #180 | Average 17.6% |
| Immigrants | Turkey | 45.6 /100 | #181 | Average 17.6% |
| Russians | 45.2 /100 | #182 | Average 17.6% |
| Immigrants | Uruguay | 44.6 /100 | #183 | Average 17.6% |
| Eastern Europeans | 44.3 /100 | #184 | Average 17.6% |
| Iroquois | 43.4 /100 | #185 | Average 17.6% |
| Japanese | 43.2 /100 | #186 | Average 17.6% |
| Immigrants | Micronesia | 42.4 /100 | #187 | Average 17.6% |
| Immigrants | Nicaragua | 42.2 /100 | #188 | Average 17.6% |
Demographics Similar to Yup'ik by Unemployment Among Ages 16 to 19 years
In terms of unemployment among ages 16 to 19 years, the demographic groups most similar to Yup'ik are Yuman (37.4%, a difference of 9.5%), Hopi (30.7%, a difference of 33.6%), Colville (29.7%, a difference of 38.1%), Navajo (29.0%, a difference of 41.1%), and Inupiat (28.1%, a difference of 46.0%).
| Demographics | Rating | Rank | Unemployment Among Ages 16 to 19 years |
| Paiute | 0.0 /100 | #333 | Tragic 24.4% |
| Guyanese | 0.0 /100 | #334 | Tragic 24.8% |
| Arapaho | 0.0 /100 | #335 | Tragic 25.2% |
| Kiowa | 0.0 /100 | #336 | Tragic 25.2% |
| Immigrants | Guyana | 0.0 /100 | #337 | Tragic 25.5% |
| Immigrants | St. Vincent and the Grenadines | 0.0 /100 | #338 | Tragic 25.7% |
| Immigrants | Grenada | 0.0 /100 | #339 | Tragic 25.7% |
| Crow | 0.0 /100 | #340 | Tragic 26.2% |
| Puerto Ricans | 0.0 /100 | #341 | Tragic 27.5% |
| Inupiat | 0.0 /100 | #342 | Tragic 28.1% |
| Navajo | 0.0 /100 | #343 | Tragic 29.0% |
| Colville | 0.0 /100 | #344 | Tragic 29.7% |
| Hopi | 0.0 /100 | #345 | Tragic 30.7% |
| Yuman | 0.0 /100 | #346 | Tragic 37.4% |
| Yup'ik | 0.0 /100 | #347 | Tragic 41.0% |