Immigrants from Turkey vs Immigrants from Croatia Unemployment Among Women with Children Under 18 years
COMPARE
Immigrants from Turkey
Immigrants from Croatia
Unemployment Among Women with Children Under 18 years
Unemployment Among Women with Children Under 18 years Comparison
Immigrants from Turkey
Immigrants from Croatia
5.2%
UNEMPLOYMENT AMONG WOMEN WITH CHILDREN UNDER 18 YEARS
94.2/ 100
METRIC RATING
89th/ 347
METRIC RANK
5.1%
UNEMPLOYMENT AMONG WOMEN WITH CHILDREN UNDER 18 YEARS
95.6/ 100
METRIC RATING
79th/ 347
METRIC RANK
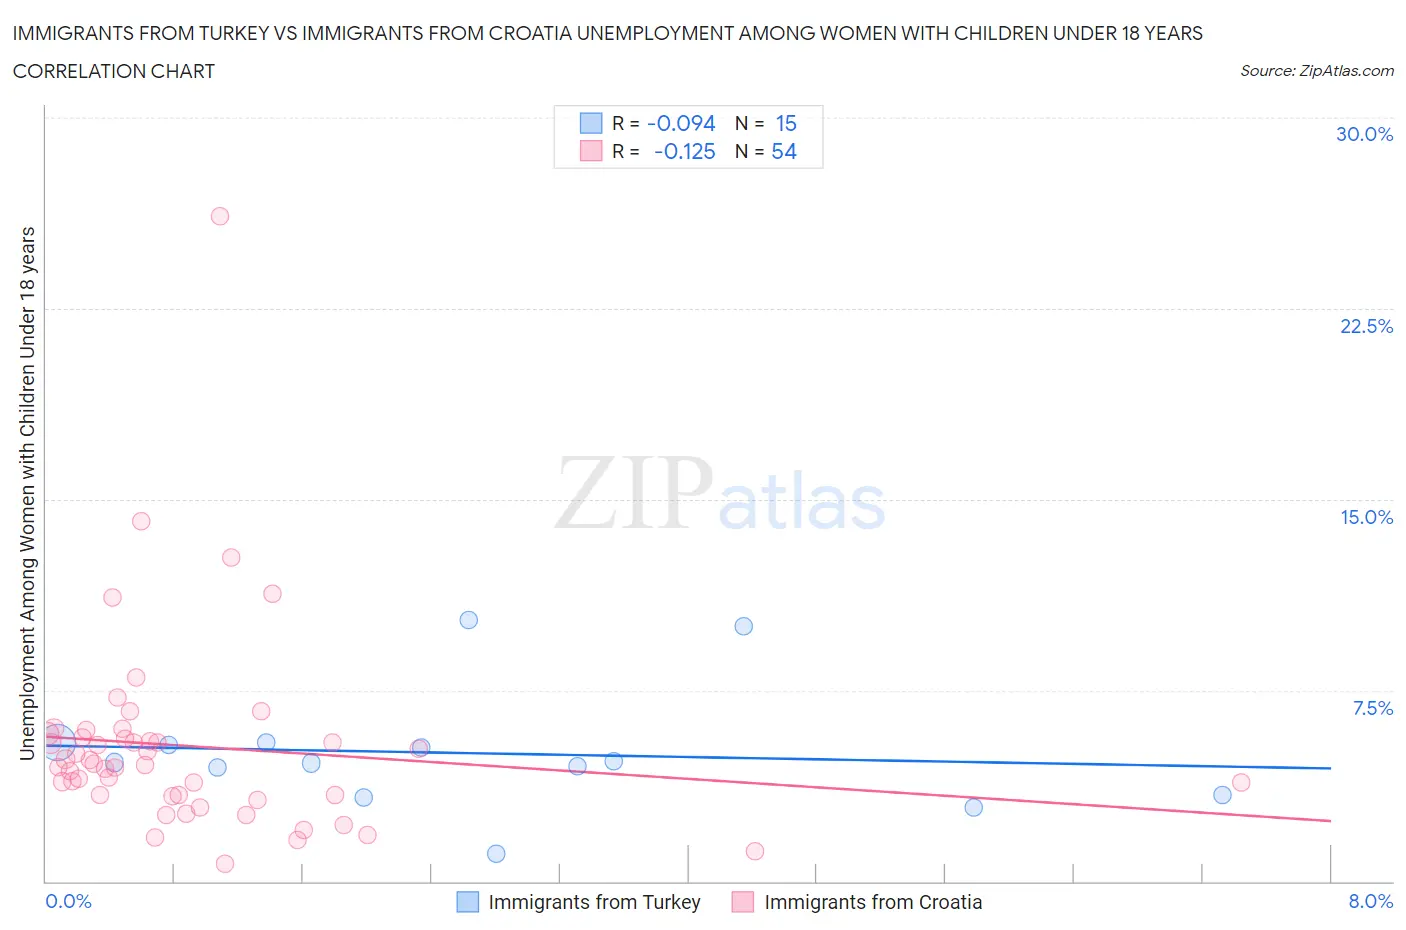
Immigrants from Turkey vs Immigrants from Croatia Unemployment Among Women with Children Under 18 years Correlation Chart
The statistical analysis conducted on geographies consisting of 218,285,752 people shows a slight negative correlation between the proportion of Immigrants from Turkey and unemployment rate among women with children under the age of 18 in the United States with a correlation coefficient (R) of -0.094 and weighted average of 5.2%. Similarly, the statistical analysis conducted on geographies consisting of 130,195,251 people shows a poor negative correlation between the proportion of Immigrants from Croatia and unemployment rate among women with children under the age of 18 in the United States with a correlation coefficient (R) of -0.125 and weighted average of 5.1%, a difference of 0.56%.
Unemployment Among Women with Children Under 18 years Correlation Summary
| Measurement | Immigrants from Turkey | Immigrants from Croatia |
| Minimum | 1.1% | 0.70% |
| Maximum | 10.3% | 26.1% |
| Range | 9.2% | 25.4% |
| Mean | 5.0% | 5.3% |
| Median | 4.7% | 4.6% |
| Interquartile 25% (IQ1) | 3.4% | 3.4% |
| Interquartile 75% (IQ3) | 5.4% | 5.7% |
| Interquartile Range (IQR) | 2.0% | 2.3% |
| Standard Deviation (Sample) | 2.4% | 3.9% |
| Standard Deviation (Population) | 2.3% | 3.9% |
Demographics Similar to Immigrants from Turkey and Immigrants from Croatia by Unemployment Among Women with Children Under 18 years
In terms of unemployment among women with children under 18 years, the demographic groups most similar to Immigrants from Turkey are Immigrants from Scotland (5.2%, a difference of 0.10%), Ukrainian (5.2%, a difference of 0.13%), Laotian (5.2%, a difference of 0.17%), Immigrants from Indonesia (5.2%, a difference of 0.20%), and Paraguayan (5.2%, a difference of 0.21%). Similarly, the demographic groups most similar to Immigrants from Croatia are Assyrian/Chaldean/Syriac (5.1%, a difference of 0.020%), Zimbabwean (5.1%, a difference of 0.040%), Bolivian (5.1%, a difference of 0.050%), Puget Sound Salish (5.1%, a difference of 0.060%), and Immigrants from Asia (5.1%, a difference of 0.090%).
| Demographics | Rating | Rank | Unemployment Among Women with Children Under 18 years |
| Immigrants | Northern Europe | 95.9 /100 | #74 | Exceptional 5.1% |
| Immigrants | Asia | 95.8 /100 | #75 | Exceptional 5.1% |
| Puget Sound Salish | 95.8 /100 | #76 | Exceptional 5.1% |
| Zimbabweans | 95.7 /100 | #77 | Exceptional 5.1% |
| Assyrians/Chaldeans/Syriacs | 95.7 /100 | #78 | Exceptional 5.1% |
| Immigrants | Croatia | 95.6 /100 | #79 | Exceptional 5.1% |
| Bolivians | 95.5 /100 | #80 | Exceptional 5.1% |
| Immigrants | Lithuania | 95.4 /100 | #81 | Exceptional 5.2% |
| Romanians | 95.3 /100 | #82 | Exceptional 5.2% |
| Maltese | 95.1 /100 | #83 | Exceptional 5.2% |
| Australians | 95.1 /100 | #84 | Exceptional 5.2% |
| Paraguayans | 94.8 /100 | #85 | Exceptional 5.2% |
| Immigrants | Indonesia | 94.8 /100 | #86 | Exceptional 5.2% |
| Laotians | 94.7 /100 | #87 | Exceptional 5.2% |
| Immigrants | Scotland | 94.5 /100 | #88 | Exceptional 5.2% |
| Immigrants | Turkey | 94.2 /100 | #89 | Exceptional 5.2% |
| Ukrainians | 93.8 /100 | #90 | Exceptional 5.2% |
| Immigrants | Zimbabwe | 93.6 /100 | #91 | Exceptional 5.2% |
| Immigrants | Pakistan | 93.3 /100 | #92 | Exceptional 5.2% |
| Immigrants | Canada | 93.3 /100 | #93 | Exceptional 5.2% |
| Immigrants | Kuwait | 92.6 /100 | #94 | Exceptional 5.2% |