Immigrants from Turkey vs Austrian Male Unemployment
COMPARE
Immigrants from Turkey
Austrian
Male Unemployment
Male Unemployment Comparison
Immigrants from Turkey
Austrians
5.1%
MALE UNEMPLOYMENT
94.4/ 100
METRIC RATING
91st/ 347
METRIC RANK
4.9%
MALE UNEMPLOYMENT
98.9/ 100
METRIC RATING
47th/ 347
METRIC RANK
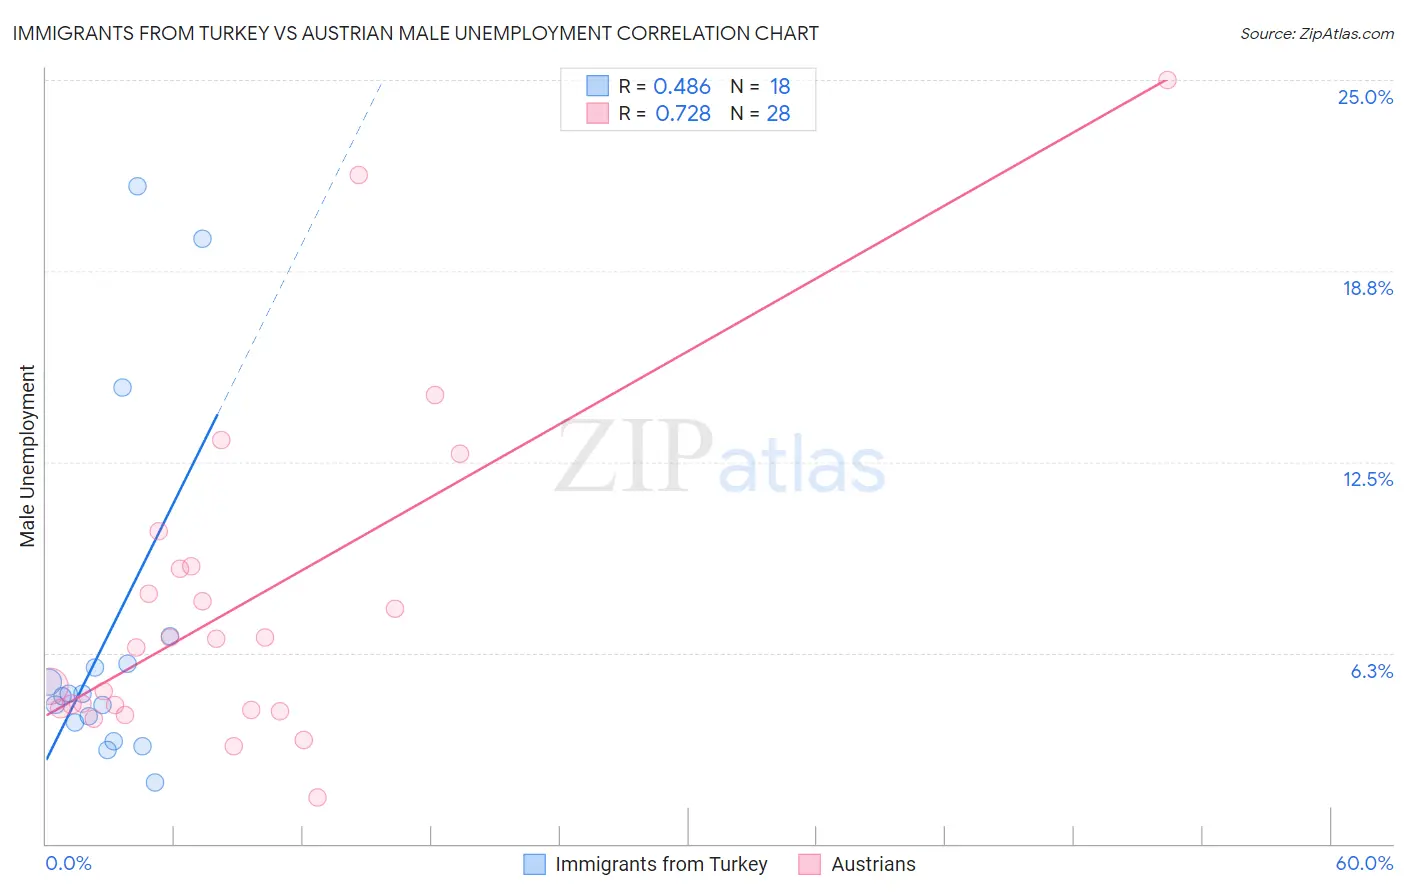
Immigrants from Turkey vs Austrian Male Unemployment Correlation Chart
The statistical analysis conducted on geographies consisting of 222,708,135 people shows a moderate positive correlation between the proportion of Immigrants from Turkey and unemployment rate among males in the United States with a correlation coefficient (R) of 0.486 and weighted average of 5.1%. Similarly, the statistical analysis conducted on geographies consisting of 448,962,183 people shows a strong positive correlation between the proportion of Austrians and unemployment rate among males in the United States with a correlation coefficient (R) of 0.728 and weighted average of 4.9%, a difference of 2.6%.
Male Unemployment Correlation Summary
| Measurement | Immigrants from Turkey | Austrian |
| Minimum | 2.0% | 1.5% |
| Maximum | 21.5% | 25.0% |
| Range | 19.5% | 23.5% |
| Mean | 6.9% | 7.8% |
| Median | 4.9% | 6.6% |
| Interquartile 25% (IQ1) | 4.0% | 4.4% |
| Interquartile 75% (IQ3) | 5.9% | 9.0% |
| Interquartile Range (IQR) | 1.9% | 4.6% |
| Standard Deviation (Sample) | 5.7% | 5.4% |
| Standard Deviation (Population) | 5.5% | 5.3% |
Similar Demographics by Male Unemployment
Demographics Similar to Immigrants from Turkey by Male Unemployment
In terms of male unemployment, the demographic groups most similar to Immigrants from Turkey are Slavic (5.1%, a difference of 0.060%), Immigrants from Serbia (5.1%, a difference of 0.060%), Okinawan (5.1%, a difference of 0.080%), Immigrants from Australia (5.1%, a difference of 0.090%), and Canadian (5.1%, a difference of 0.10%).
| Demographics | Rating | Rank | Male Unemployment |
| Serbians | 95.7 /100 | #84 | Exceptional 5.1% |
| Immigrants | North Macedonia | 95.6 /100 | #85 | Exceptional 5.1% |
| Maltese | 95.5 /100 | #86 | Exceptional 5.1% |
| Immigrants | Romania | 95.4 /100 | #87 | Exceptional 5.1% |
| Immigrants | Sri Lanka | 94.9 /100 | #88 | Exceptional 5.1% |
| Immigrants | Australia | 94.7 /100 | #89 | Exceptional 5.1% |
| Okinawans | 94.7 /100 | #90 | Exceptional 5.1% |
| Immigrants | Turkey | 94.4 /100 | #91 | Exceptional 5.1% |
| Slavs | 94.2 /100 | #92 | Exceptional 5.1% |
| Immigrants | Serbia | 94.2 /100 | #93 | Exceptional 5.1% |
| Canadians | 94.1 /100 | #94 | Exceptional 5.1% |
| Italians | 93.8 /100 | #95 | Exceptional 5.1% |
| Asians | 93.7 /100 | #96 | Exceptional 5.1% |
| Immigrants | Spain | 93.4 /100 | #97 | Exceptional 5.1% |
| Immigrants | Kuwait | 93.3 /100 | #98 | Exceptional 5.1% |
Demographics Similar to Austrians by Male Unemployment
In terms of male unemployment, the demographic groups most similar to Austrians are Immigrants from Scotland (4.9%, a difference of 0.020%), Polish (4.9%, a difference of 0.030%), Croatian (4.9%, a difference of 0.040%), Bhutanese (4.9%, a difference of 0.070%), and Slovene (5.0%, a difference of 0.070%).
| Demographics | Rating | Rank | Male Unemployment |
| Northern Europeans | 99.3 /100 | #40 | Exceptional 4.9% |
| Chinese | 99.3 /100 | #41 | Exceptional 4.9% |
| Immigrants | Belgium | 99.2 /100 | #42 | Exceptional 4.9% |
| Immigrants | Japan | 99.2 /100 | #43 | Exceptional 4.9% |
| Immigrants | Korea | 99.1 /100 | #44 | Exceptional 4.9% |
| Immigrants | Zimbabwe | 99.0 /100 | #45 | Exceptional 4.9% |
| Bhutanese | 98.9 /100 | #46 | Exceptional 4.9% |
| Austrians | 98.9 /100 | #47 | Exceptional 4.9% |
| Immigrants | Scotland | 98.9 /100 | #48 | Exceptional 4.9% |
| Poles | 98.9 /100 | #49 | Exceptional 4.9% |
| Croatians | 98.9 /100 | #50 | Exceptional 4.9% |
| Slovenes | 98.8 /100 | #51 | Exceptional 5.0% |
| Irish | 98.8 /100 | #52 | Exceptional 5.0% |
| Jordanians | 98.8 /100 | #53 | Exceptional 5.0% |
| Yugoslavians | 98.7 /100 | #54 | Exceptional 5.0% |