Immigrants from Trinidad and Tobago vs Yakama Unemployment Among Ages 45 to 54 years
COMPARE
Immigrants from Trinidad and Tobago
Yakama
Unemployment Among Ages 45 to 54 years
Unemployment Among Ages 45 to 54 years Comparison
Immigrants from Trinidad and Tobago
Yakama
5.3%
UNEMPLOYMENT AMONG AGES 45 TO 54 YEARS
0.0/ 100
METRIC RATING
298th/ 347
METRIC RANK
5.7%
UNEMPLOYMENT AMONG AGES 45 TO 54 YEARS
0.0/ 100
METRIC RATING
321st/ 347
METRIC RANK
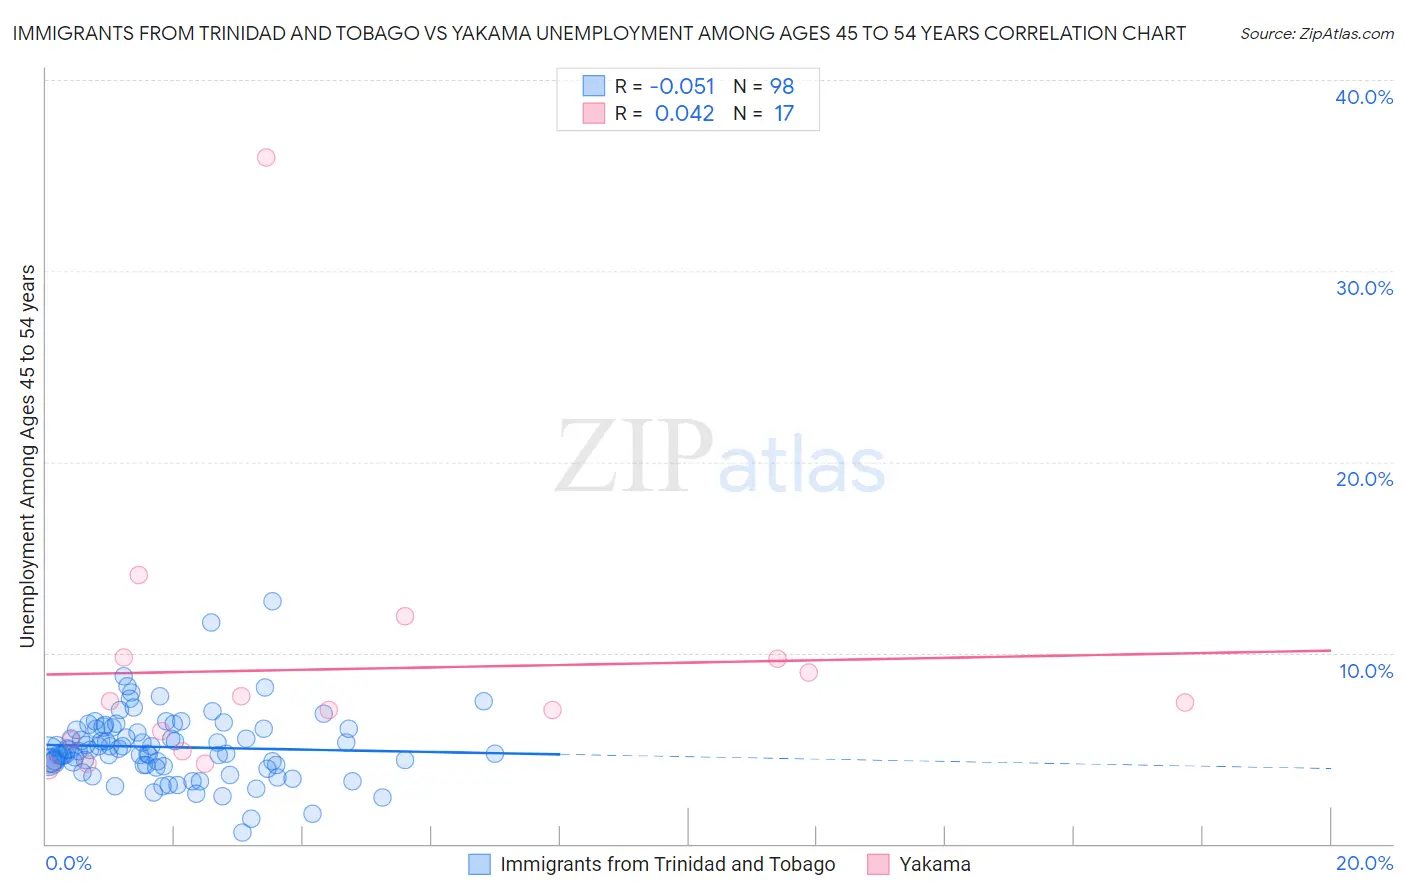
Immigrants from Trinidad and Tobago vs Yakama Unemployment Among Ages 45 to 54 years Correlation Chart
The statistical analysis conducted on geographies consisting of 220,989,097 people shows a slight negative correlation between the proportion of Immigrants from Trinidad and Tobago and unemployment rate among population between the ages 45 and 54 in the United States with a correlation coefficient (R) of -0.051 and weighted average of 5.3%. Similarly, the statistical analysis conducted on geographies consisting of 19,676,341 people shows no correlation between the proportion of Yakama and unemployment rate among population between the ages 45 and 54 in the United States with a correlation coefficient (R) of 0.042 and weighted average of 5.7%, a difference of 8.5%.
Unemployment Among Ages 45 to 54 years Correlation Summary
| Measurement | Immigrants from Trinidad and Tobago | Yakama |
| Minimum | 0.60% | 4.0% |
| Maximum | 12.7% | 36.0% |
| Range | 12.1% | 32.0% |
| Mean | 5.1% | 9.1% |
| Median | 4.9% | 7.4% |
| Interquartile 25% (IQ1) | 4.1% | 5.1% |
| Interquartile 75% (IQ3) | 6.0% | 9.7% |
| Interquartile Range (IQR) | 1.9% | 4.6% |
| Standard Deviation (Sample) | 1.8% | 7.4% |
| Standard Deviation (Population) | 1.8% | 7.2% |
Similar Demographics by Unemployment Among Ages 45 to 54 years
Demographics Similar to Immigrants from Trinidad and Tobago by Unemployment Among Ages 45 to 54 years
In terms of unemployment among ages 45 to 54 years, the demographic groups most similar to Immigrants from Trinidad and Tobago are Ecuadorian (5.3%, a difference of 0.020%), Aleut (5.3%, a difference of 0.12%), West Indian (5.3%, a difference of 0.12%), Central American Indian (5.3%, a difference of 0.23%), and Jamaican (5.3%, a difference of 0.31%).
| Demographics | Rating | Rank | Unemployment Among Ages 45 to 54 years |
| Armenians | 0.0 /100 | #291 | Tragic 5.2% |
| Trinidadians and Tobagonians | 0.0 /100 | #292 | Tragic 5.2% |
| Immigrants | Senegal | 0.0 /100 | #293 | Tragic 5.2% |
| Belizeans | 0.0 /100 | #294 | Tragic 5.2% |
| Jamaicans | 0.0 /100 | #295 | Tragic 5.3% |
| Aleuts | 0.0 /100 | #296 | Tragic 5.3% |
| West Indians | 0.0 /100 | #297 | Tragic 5.3% |
| Immigrants | Trinidad and Tobago | 0.0 /100 | #298 | Tragic 5.3% |
| Ecuadorians | 0.0 /100 | #299 | Tragic 5.3% |
| Central American Indians | 0.0 /100 | #300 | Tragic 5.3% |
| Menominee | 0.0 /100 | #301 | Tragic 5.3% |
| Immigrants | Ecuador | 0.0 /100 | #302 | Tragic 5.3% |
| Immigrants | Belize | 0.0 /100 | #303 | Tragic 5.3% |
| Immigrants | Jamaica | 0.0 /100 | #304 | Tragic 5.4% |
| Immigrants | West Indies | 0.0 /100 | #305 | Tragic 5.4% |
Demographics Similar to Yakama by Unemployment Among Ages 45 to 54 years
In terms of unemployment among ages 45 to 54 years, the demographic groups most similar to Yakama are Immigrants from St. Vincent and the Grenadines (5.7%, a difference of 0.35%), Cape Verdean (5.7%, a difference of 0.36%), Immigrants from the Azores (5.7%, a difference of 0.51%), British West Indian (5.7%, a difference of 0.90%), and Houma (5.6%, a difference of 1.5%).
| Demographics | Rating | Rank | Unemployment Among Ages 45 to 54 years |
| Guyanese | 0.0 /100 | #314 | Tragic 5.6% |
| Immigrants | Dominica | 0.0 /100 | #315 | Tragic 5.6% |
| Immigrants | Guyana | 0.0 /100 | #316 | Tragic 5.6% |
| Houma | 0.0 /100 | #317 | Tragic 5.6% |
| British West Indians | 0.0 /100 | #318 | Tragic 5.7% |
| Cape Verdeans | 0.0 /100 | #319 | Tragic 5.7% |
| Immigrants | St. Vincent and the Grenadines | 0.0 /100 | #320 | Tragic 5.7% |
| Yakama | 0.0 /100 | #321 | Tragic 5.7% |
| Immigrants | Azores | 0.0 /100 | #322 | Tragic 5.7% |
| Immigrants | Cabo Verde | 0.0 /100 | #323 | Tragic 5.9% |
| Natives/Alaskans | 0.0 /100 | #324 | Tragic 6.1% |
| Immigrants | Armenia | 0.0 /100 | #325 | Tragic 6.1% |
| Ute | 0.0 /100 | #326 | Tragic 6.2% |
| Dominicans | 0.0 /100 | #327 | Tragic 6.2% |
| Pueblo | 0.0 /100 | #328 | Tragic 6.2% |