Immigrants from Syria vs European Unemployment Among Youth under 25 years

COMPARE

Immigrants from Syria
Race
Ancestry
AfghanAfricanAlaska NativeAlaskan AthabascanAlbanianAleutAlsatianAmericanApacheArabArapahoArgentineanArmenianAssyrian/Chaldean/SyriacAustralianAustrianBahamianBangladeshiBarbadianBasqueBelgianBelizeanBermudanBhutaneseBlackfeetBolivianBrazilianBritishBritish West IndianBulgarianBurmeseCajunCambodianCanadianCape VerdeanCarpatho RusynCelticCentral AmericanCentral American IndianCherokeeCheyenneChickasawChileanChineseChippewaChoctawColombianColvilleComancheCosta RicanCreeCreekCroatianCrowCubanCypriotCzechCzechoslovakianDanishDelawareDominicanDutchDutch West IndianEastern EuropeanEcuadorianEgyptianEnglishEstonianEthiopianFijianFilipinoFinnishFrenchFrench American IndianFrench CanadianGermanGerman RussianGhanaianGreekGuamanian/ChamorroGuatemalanGuyaneseHaitianHmongHonduranHopiHoumaHungarianIcelanderIndian (Asian)IndonesianInupiatIranianIraqiIrishIroquoisIsraeliItalianJamaicanJapaneseJordanianKenyanKiowaKoreanLaotianLatvianLebaneseLiberianLithuanianLumbeeLuxembourgerMacedonianMalaysianMalteseMarshalleseMenomineeMexicanMexican American IndianMongolianMoroccanNative HawaiianNavajoNepaleseNew ZealanderNicaraguanNigerianNorthern EuropeanNorwegianOkinawanOsageOttawaPaiutePakistaniPalestinianPanamanianParaguayanPennsylvania GermanPeruvianPimaPolishPortuguesePotawatomiPuebloPuerto RicanPuget Sound SalishRomanianRussianSalvadoranSamoanScandinavianScotch-IrishScottishSeminoleSenegaleseSerbianShoshoneSierra LeoneanSiouxSlavicSlovakSloveneSomaliSouth AfricanSouth AmericanSouth American IndianSoviet UnionSpaniardSpanishSpanish AmericanSpanish American IndianSri LankanSubsaharan AfricanSudaneseSwedishSwissSyrianTaiwaneseThaiTlingit-HaidaTohono O'OdhamTonganTrinidadian and TobagonianTsimshianTurkishU.S. Virgin IslanderUgandanUkrainianUruguayanUteVenezuelanVietnameseWelshWest IndianYakamaYaquiYugoslavianYumanYup'ikZimbabwean
Immigration
NonimmigrantsImmigrantsAfghanistanAfricaAlbaniaArgentinaArmeniaAsiaAustraliaAustriaBahamasBangladeshBarbadosBelarusBelgiumBelizeBoliviaBosnia and HerzegovinaBrazilBulgariaBurma/MyanmarCabo VerdeCambodiaCameroonCanadaCaribbeanCentral AmericaChileChinaColombiaCongoCosta RicaCroatiaCubaCzechoslovakiaDenmarkDominicaDominican RepublicEastern AfricaEastern AsiaEastern EuropeEcuadorEgyptEl SalvadorEnglandEritreaEthiopiaEuropeFijiFranceGermanyGhanaGreeceGrenadaGuatemalaGuyanaHaitiHondurasHong KongHungaryIndiaIndonesiaIranIraqIrelandIsraelItalyJamaicaJapanJordanKazakhstanKenyaKoreaKuwaitLaosLatin AmericaLatviaLebanonLiberiaLithuaniaMalaysiaMexicoMicronesiaMiddle AfricaMoldovaMoroccoNepalNetherlandsNicaraguaNigeriaNorth AmericaNorth MacedoniaNorthern AfricaNorthern EuropeNorwayOceaniaPakistanPanamaPeruPhilippinesPolandPortugalRomaniaRussiaSaudi ArabiaScotlandSenegalSerbiaSierra LeoneSingaporeSomaliaSouth AfricaSouth AmericaSouth Central AsiaSouth Eastern AsiaSouthern EuropeSpainSri LankaSt. Vincent and the GrenadinesSudanSwedenSwitzerlandSyriaTaiwanThailandTrinidad and TobagoTurkeyUgandaUkraineUruguayUzbekistanVenezuelaVietnamWest IndiesWestern AfricaWestern AsiaWestern EuropeYemenZaireZimbabweAzores
European
Race
Ancestry
AfghanAfricanAlaska NativeAlaskan AthabascanAlbanianAleutAlsatianAmericanApacheArabArapahoArgentineanArmenianAssyrian/Chaldean/SyriacAustralianAustrianBahamianBangladeshiBarbadianBasqueBelgianBelizeanBermudanBhutaneseBlackfeetBolivianBrazilianBritishBritish West IndianBulgarianBurmeseCajunCambodianCanadianCape VerdeanCarpatho RusynCelticCentral AmericanCentral American IndianCherokeeCheyenneChickasawChileanChineseChippewaChoctawColombianColvilleComancheCosta RicanCreeCreekCroatianCrowCubanCypriotCzechCzechoslovakianDanishDelawareDominicanDutchDutch West IndianEastern EuropeanEcuadorianEgyptianEnglishEstonianEthiopianEuropeanFijianFilipinoFinnishFrenchFrench American IndianFrench CanadianGermanGerman RussianGhanaianGreekGuamanian/ChamorroGuatemalanGuyaneseHaitianHmongHonduranHopiHoumaHungarianIcelanderIndian (Asian)IndonesianInupiatIranianIraqiIrishIroquoisIsraeliItalianJamaicanJapaneseJordanianKenyanKiowaKoreanLaotianLatvianLebaneseLiberianLithuanianLumbeeLuxembourgerMacedonianMalaysianMalteseMarshalleseMenomineeMexicanMexican American IndianMongolianMoroccanNative HawaiianNavajoNepaleseNew ZealanderNicaraguanNigerianNorthern EuropeanNorwegianOkinawanOsageOttawaPaiutePakistaniPalestinianPanamanianParaguayanPennsylvania GermanPeruvianPimaPolishPortuguesePotawatomiPuebloPuerto RicanPuget Sound SalishRomanianRussianSalvadoranSamoanScandinavianScotch-IrishScottishSeminoleSenegaleseSerbianShoshoneSierra LeoneanSiouxSlavicSlovakSloveneSomaliSouth AfricanSouth AmericanSouth American IndianSoviet UnionSpaniardSpanishSpanish AmericanSpanish American IndianSri LankanSubsaharan AfricanSudaneseSwedishSwissSyrianTaiwaneseThaiTlingit-HaidaTohono O'OdhamTonganTrinidadian and TobagonianTsimshianTurkishU.S. Virgin IslanderUgandanUkrainianUruguayanUteVenezuelanVietnameseWelshWest IndianYakamaYaquiYugoslavianYumanYup'ikZimbabwean
Immigration
NonimmigrantsImmigrantsAfghanistanAfricaAlbaniaArgentinaArmeniaAsiaAustraliaAustriaBahamasBangladeshBarbadosBelarusBelgiumBelizeBoliviaBosnia and HerzegovinaBrazilBulgariaBurma/MyanmarCabo VerdeCambodiaCameroonCanadaCaribbeanCentral AmericaChileChinaColombiaCongoCosta RicaCroatiaCubaCzechoslovakiaDenmarkDominicaDominican RepublicEastern AfricaEastern AsiaEastern EuropeEcuadorEgyptEl SalvadorEnglandEritreaEthiopiaEuropeFijiFranceGermanyGhanaGreeceGrenadaGuatemalaGuyanaHaitiHondurasHong KongHungaryIndiaIndonesiaIranIraqIrelandIsraelItalyJamaicaJapanJordanKazakhstanKenyaKoreaKuwaitLaosLatin AmericaLatviaLebanonLiberiaLithuaniaMalaysiaMexicoMicronesiaMiddle AfricaMoldovaMoroccoNepalNetherlandsNicaraguaNigeriaNorth AmericaNorth MacedoniaNorthern AfricaNorthern EuropeNorwayOceaniaPakistanPanamaPeruPhilippinesPolandPortugalRomaniaRussiaSaudi ArabiaScotlandSenegalSerbiaSierra LeoneSingaporeSomaliaSouth AfricaSouth AmericaSouth Central AsiaSouth Eastern AsiaSouthern EuropeSpainSri LankaSt. Vincent and the GrenadinesSudanSwedenSwitzerlandTaiwanThailandTrinidad and TobagoTurkeyUgandaUkraineUruguayUzbekistanVenezuelaVietnamWest IndiesWestern AfricaWestern AsiaWestern EuropeYemenZaireZimbabweAzores
Unemployment Among Youth under 25 years
Income
Poverty
Unemployment
Labor Participation
Family Structure
Vehicle Availability
Education Level
Disability

Unemployment Among Youth under 25 years Comparison

Immigrants from Syria

Europeans

Tragic
Exceptional
12.3%
UNEMPLOYMENT AMONG YOUTH UNDER 25 YEARS
0.3/ 100
METRIC RATING
252nd/ 347
METRIC RANK
10.8%
UNEMPLOYMENT AMONG YOUTH UNDER 25 YEARS
99.9/ 100
METRIC RATING
33rd/ 347
METRIC RANK

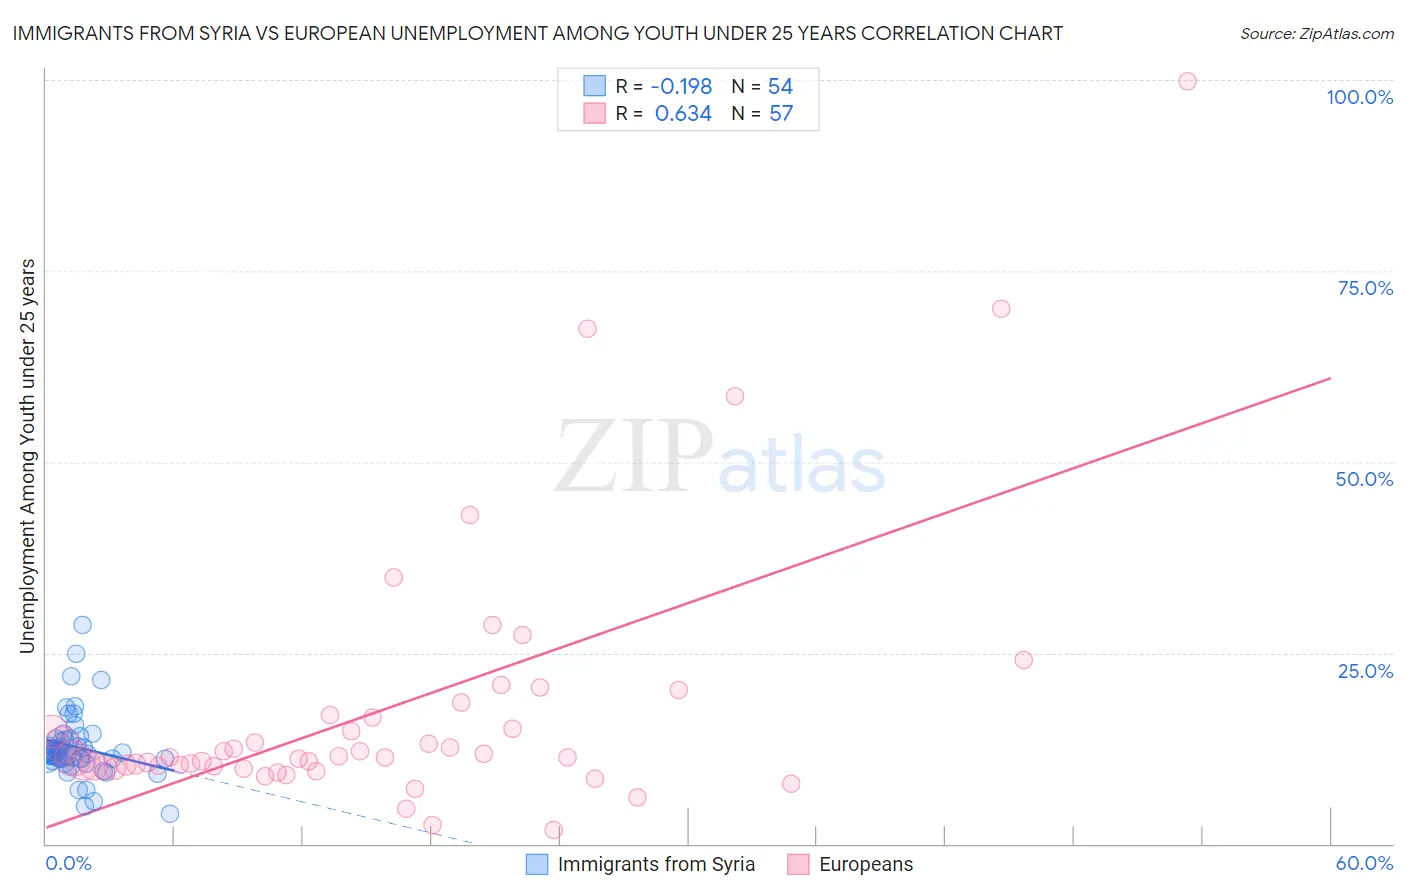
Immigrants from Syria vs European Unemployment Among Youth under 25 years Correlation Chart

The statistical analysis conducted on geographies consisting of 173,556,905 people shows a poor negative correlation between the proportion of Immigrants from Syria and unemployment rate among youth under the age of 25 in the United States with a correlation coefficient (R) of -0.198 and weighted average of 12.3%. Similarly, the statistical analysis conducted on geographies consisting of 539,832,325 people shows a significant positive correlation between the proportion of Europeans and unemployment rate among youth under the age of 25 in the United States with a correlation coefficient (R) of 0.634 and weighted average of 10.8%, a difference of 13.9%.
Immigrants from Syria vs European Unemployment Among Youth under 25 years

Unemployment Among Youth under 25 years Correlation Summary

MeasurementImmigrants from SyriaEuropean
Minimum4.0%1.8%
Maximum28.6%99.9%
Range24.6%98.1%
Mean12.6%17.5%
Median11.9%11.3%
Interquartile 25% (IQ1)11.1%10.1%
Interquartile 75% (IQ3)13.7%16.7%
Interquartile Range (IQR)2.6%6.6%
Standard Deviation (Sample)4.4%17.7%
Standard Deviation (Population)4.3%17.5%

Similar Demographics by Unemployment Among Youth under 25 years

Demographics Similar to Immigrants from Syria by Unemployment Among Youth under 25 years

In terms of unemployment among youth under 25 years, the demographic groups most similar to Immigrants from Syria are Mexican American Indian (12.3%, a difference of 0.040%), Mexican (12.3%, a difference of 0.040%), Honduran (12.3%, a difference of 0.060%), Delaware (12.3%, a difference of 0.070%), and Soviet Union (12.2%, a difference of 0.49%).
DemographicsRating | RankUnemployment Among Youth under 25 years
Spanish Americans
0.6
/100
|
#245
Tragic
12.2%
Immigrants | Honduras
0.6
/100
|
#246
Tragic
12.2%
Immigrants | Greece
0.6
/100
|
#247
Tragic
12.2%
Central Americans
0.6
/100
|
#248
Tragic
12.2%
Soviet Union
0.6
/100
|
#249
Tragic
12.2%
Delaware
0.4
/100
|
#250
Tragic
12.3%
Mexican American Indians
0.4
/100
|
#251
Tragic
12.3%
Immigrants | Syria
0.3
/100
|
#252
Tragic
12.3%
Mexicans
0.3
/100
|
#253
Tragic
12.3%
Hondurans
0.3
/100
|
#254
Tragic
12.3%
Hispanics or Latinos
0.2
/100
|
#255
Tragic
12.4%
Liberians
0.2
/100
|
#256
Tragic
12.4%
Panamanians
0.2
/100
|
#257
Tragic
12.4%
Salvadorans
0.1
/100
|
#258
Tragic
12.4%
Immigrants | Central America
0.1
/100
|
#259
Tragic
12.4%

Demographics Similar to Europeans by Unemployment Among Youth under 25 years

In terms of unemployment among youth under 25 years, the demographic groups most similar to Europeans are Taiwanese (10.8%, a difference of 0.22%), English (10.8%, a difference of 0.27%), Immigrants from Nepal (10.8%, a difference of 0.35%), Slovene (10.7%, a difference of 0.48%), and Hmong (10.8%, a difference of 0.48%).
DemographicsRating | RankUnemployment Among Youth under 25 years
Immigrants | India
100.0
/100
|
#26
Exceptional
10.7%
Yugoslavians
100.0
/100
|
#27
Exceptional
10.7%
Somalis
100.0
/100
|
#28
Exceptional
10.7%
Chinese
99.9
/100
|
#29
Exceptional
10.7%
Osage
99.9
/100
|
#30
Exceptional
10.7%
Slovenes
99.9
/100
|
#31
Exceptional
10.7%
Taiwanese
99.9
/100
|
#32
Exceptional
10.8%
Europeans
99.9
/100
|
#33
Exceptional
10.8%
English
99.9
/100
|
#34
Exceptional
10.8%
Immigrants | Nepal
99.9
/100
|
#35
Exceptional
10.8%
Hmong
99.8
/100
|
#36
Exceptional
10.8%
Immigrants | Zimbabwe
99.8
/100
|
#37
Exceptional
10.8%
Immigrants | Congo
99.8
/100
|
#38
Exceptional
10.9%
Immigrants | Zaire
99.8
/100
|
#39
Exceptional
10.9%
Scottish
99.8
/100
|
#40
Exceptional
10.9%