Immigrants from Sudan vs Laotian Unemployment Among Ages 55 to 59 years
COMPARE
Immigrants from Sudan
Laotian
Unemployment Among Ages 55 to 59 years
Unemployment Among Ages 55 to 59 years Comparison
Immigrants from Sudan
Laotians
4.8%
UNEMPLOYMENT AMONG AGES 55 TO 59 YEARS
58.4/ 100
METRIC RATING
169th/ 347
METRIC RANK
4.8%
UNEMPLOYMENT AMONG AGES 55 TO 59 YEARS
68.2/ 100
METRIC RATING
152nd/ 347
METRIC RANK
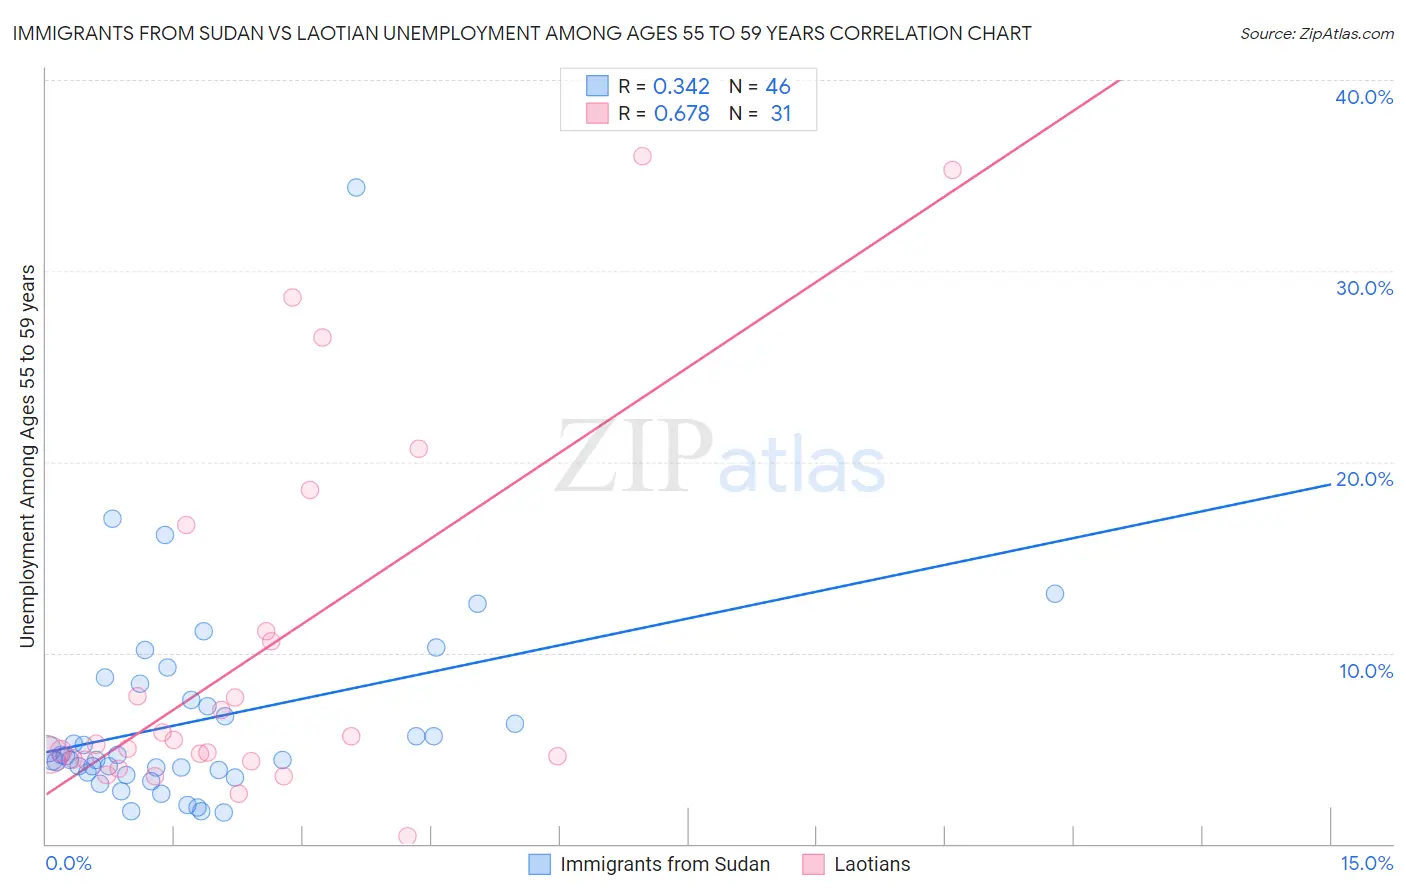
Immigrants from Sudan vs Laotian Unemployment Among Ages 55 to 59 years Correlation Chart
The statistical analysis conducted on geographies consisting of 116,851,236 people shows a mild positive correlation between the proportion of Immigrants from Sudan and unemployment rate among population between the ages 55 and 59 in the United States with a correlation coefficient (R) of 0.342 and weighted average of 4.8%. Similarly, the statistical analysis conducted on geographies consisting of 216,833,700 people shows a significant positive correlation between the proportion of Laotians and unemployment rate among population between the ages 55 and 59 in the United States with a correlation coefficient (R) of 0.678 and weighted average of 4.8%, a difference of 0.43%.
Unemployment Among Ages 55 to 59 years Correlation Summary
| Measurement | Immigrants from Sudan | Laotian |
| Minimum | 1.6% | 0.40% |
| Maximum | 34.4% | 36.0% |
| Range | 32.8% | 35.6% |
| Mean | 6.5% | 9.9% |
| Median | 4.5% | 5.2% |
| Interquartile 25% (IQ1) | 3.7% | 4.4% |
| Interquartile 75% (IQ3) | 7.5% | 11.1% |
| Interquartile Range (IQR) | 3.8% | 6.7% |
| Standard Deviation (Sample) | 5.6% | 9.7% |
| Standard Deviation (Population) | 5.5% | 9.6% |
Demographics Similar to Immigrants from Sudan and Laotians by Unemployment Among Ages 55 to 59 years
In terms of unemployment among ages 55 to 59 years, the demographic groups most similar to Immigrants from Sudan are Immigrants from Cambodia (4.8%, a difference of 0.040%), Immigrants from Western Europe (4.8%, a difference of 0.080%), Uruguayan (4.8%, a difference of 0.12%), Immigrants from France (4.8%, a difference of 0.15%), and Potawatomi (4.8%, a difference of 0.15%). Similarly, the demographic groups most similar to Laotians are Bahamian (4.8%, a difference of 0.020%), Immigrants from Uruguay (4.8%, a difference of 0.050%), Immigrants from Panama (4.8%, a difference of 0.070%), Immigrants from Northern Africa (4.8%, a difference of 0.080%), and Immigrants from North Macedonia (4.8%, a difference of 0.090%).
| Demographics | Rating | Rank | Unemployment Among Ages 55 to 59 years |
| Immigrants | Northern Africa | 69.8 /100 | #150 | Good 4.8% |
| Bahamians | 68.6 /100 | #151 | Good 4.8% |
| Laotians | 68.2 /100 | #152 | Good 4.8% |
| Immigrants | Uruguay | 67.2 /100 | #153 | Good 4.8% |
| Immigrants | Panama | 66.8 /100 | #154 | Good 4.8% |
| Immigrants | North Macedonia | 66.3 /100 | #155 | Good 4.8% |
| Italians | 66.2 /100 | #156 | Good 4.8% |
| Carpatho Rusyns | 66.0 /100 | #157 | Good 4.8% |
| Slovaks | 65.3 /100 | #158 | Good 4.8% |
| Immigrants | Nicaragua | 65.2 /100 | #159 | Good 4.8% |
| Chickasaw | 65.1 /100 | #160 | Good 4.8% |
| Koreans | 64.6 /100 | #161 | Good 4.8% |
| Immigrants | Africa | 64.2 /100 | #162 | Good 4.8% |
| Immigrants | Lebanon | 63.8 /100 | #163 | Good 4.8% |
| Americans | 63.3 /100 | #164 | Good 4.8% |
| Immigrants | France | 62.0 /100 | #165 | Good 4.8% |
| Potawatomi | 62.0 /100 | #166 | Good 4.8% |
| Immigrants | Western Europe | 60.4 /100 | #167 | Good 4.8% |
| Immigrants | Cambodia | 59.3 /100 | #168 | Average 4.8% |
| Immigrants | Sudan | 58.4 /100 | #169 | Average 4.8% |
| Uruguayans | 55.6 /100 | #170 | Average 4.8% |