Immigrants from Sudan vs Immigrants from Indonesia Unemployment Among Ages 60 to 64 years

COMPARE

Immigrants from Sudan
Race
Ancestry
AfghanAfricanAlaska NativeAlaskan AthabascanAlbanianAleutAlsatianAmericanApacheArabArapahoArgentineanArmenianAssyrian/Chaldean/SyriacAustralianAustrianBahamianBangladeshiBarbadianBasqueBelgianBelizeanBermudanBhutaneseBlackfeetBolivianBrazilianBritishBritish West IndianBulgarianBurmeseCajunCambodianCanadianCape VerdeanCarpatho RusynCelticCentral AmericanCentral American IndianCherokeeCheyenneChickasawChileanChineseChippewaChoctawColombianColvilleComancheCosta RicanCreeCreekCroatianCrowCubanCypriotCzechCzechoslovakianDanishDelawareDominicanDutchDutch West IndianEastern EuropeanEcuadorianEgyptianEnglishEstonianEthiopianEuropeanFijianFilipinoFinnishFrenchFrench American IndianFrench CanadianGermanGerman RussianGhanaianGreekGuamanian/ChamorroGuatemalanGuyaneseHaitianHmongHonduranHopiHoumaHungarianIcelanderIndian (Asian)IndonesianInupiatIranianIraqiIrishIroquoisIsraeliItalianJamaicanJapaneseJordanianKenyanKiowaKoreanLaotianLatvianLebaneseLiberianLithuanianLumbeeLuxembourgerMacedonianMalaysianMalteseMarshalleseMenomineeMexicanMexican American IndianMongolianMoroccanNative HawaiianNavajoNepaleseNew ZealanderNicaraguanNigerianNorthern EuropeanNorwegianOkinawanOsageOttawaPaiutePakistaniPalestinianPanamanianParaguayanPennsylvania GermanPeruvianPimaPolishPortuguesePotawatomiPuebloPuerto RicanPuget Sound SalishRomanianRussianSalvadoranSamoanScandinavianScotch-IrishScottishSeminoleSenegaleseSerbianShoshoneSierra LeoneanSiouxSlavicSlovakSloveneSomaliSouth AfricanSouth AmericanSouth American IndianSoviet UnionSpaniardSpanishSpanish AmericanSpanish American IndianSri LankanSubsaharan AfricanSudaneseSwedishSwissSyrianTaiwaneseThaiTlingit-HaidaTohono O'OdhamTonganTrinidadian and TobagonianTsimshianTurkishU.S. Virgin IslanderUgandanUkrainianUruguayanUteVenezuelanVietnameseWelshWest IndianYakamaYaquiYugoslavianYumanYup'ikZimbabwean
Immigration
NonimmigrantsImmigrantsAfghanistanAfricaAlbaniaArgentinaArmeniaAsiaAustraliaAustriaBahamasBangladeshBarbadosBelarusBelgiumBelizeBoliviaBosnia and HerzegovinaBrazilBulgariaBurma/MyanmarCabo VerdeCambodiaCameroonCanadaCaribbeanCentral AmericaChileChinaColombiaCongoCosta RicaCroatiaCubaCzechoslovakiaDenmarkDominicaDominican RepublicEastern AfricaEastern AsiaEastern EuropeEcuadorEgyptEl SalvadorEnglandEritreaEthiopiaEuropeFijiFranceGermanyGhanaGreeceGrenadaGuatemalaGuyanaHaitiHondurasHong KongHungaryIndiaIranIraqIrelandIsraelItalyJamaicaJapanJordanKazakhstanKenyaKoreaKuwaitLaosLatin AmericaLatviaLebanonLiberiaLithuaniaMalaysiaMexicoMicronesiaMiddle AfricaMoldovaMoroccoNepalNetherlandsNicaraguaNigeriaNorth AmericaNorth MacedoniaNorthern AfricaNorthern EuropeNorwayOceaniaPakistanPanamaPeruPhilippinesPolandPortugalRomaniaRussiaSaudi ArabiaScotlandSenegalSerbiaSierra LeoneSingaporeSomaliaSouth AfricaSouth AmericaSouth Central AsiaSouth Eastern AsiaSouthern EuropeSpainSri LankaSt. Vincent and the GrenadinesSudanSwedenSwitzerlandSyriaTaiwanThailandTrinidad and TobagoTurkeyUgandaUkraineUruguayUzbekistanVenezuelaVietnamWest IndiesWestern AfricaWestern AsiaWestern EuropeYemenZaireZimbabweAzores
Immigrants from Indonesia
Race
Ancestry
AfghanAfricanAlaska NativeAlaskan AthabascanAlbanianAleutAlsatianAmericanApacheArabArapahoArgentineanArmenianAssyrian/Chaldean/SyriacAustralianAustrianBahamianBangladeshiBarbadianBasqueBelgianBelizeanBermudanBhutaneseBlackfeetBolivianBrazilianBritishBritish West IndianBulgarianBurmeseCajunCambodianCanadianCape VerdeanCarpatho RusynCelticCentral AmericanCentral American IndianCherokeeCheyenneChickasawChileanChineseChippewaChoctawColombianColvilleComancheCosta RicanCreeCreekCroatianCrowCubanCypriotCzechCzechoslovakianDanishDelawareDominicanDutchDutch West IndianEastern EuropeanEcuadorianEgyptianEnglishEstonianEthiopianEuropeanFijianFilipinoFinnishFrenchFrench American IndianFrench CanadianGermanGerman RussianGhanaianGreekGuamanian/ChamorroGuatemalanGuyaneseHaitianHmongHonduranHopiHoumaHungarianIcelanderIndian (Asian)IndonesianInupiatIranianIraqiIrishIroquoisIsraeliItalianJamaicanJapaneseJordanianKenyanKiowaKoreanLaotianLatvianLebaneseLiberianLithuanianLumbeeLuxembourgerMacedonianMalaysianMalteseMarshalleseMenomineeMexicanMexican American IndianMongolianMoroccanNative HawaiianNavajoNepaleseNew ZealanderNicaraguanNigerianNorthern EuropeanNorwegianOkinawanOsageOttawaPaiutePakistaniPalestinianPanamanianParaguayanPennsylvania GermanPeruvianPimaPolishPortuguesePotawatomiPuebloPuerto RicanPuget Sound SalishRomanianRussianSalvadoranSamoanScandinavianScotch-IrishScottishSeminoleSenegaleseSerbianShoshoneSierra LeoneanSiouxSlavicSlovakSloveneSomaliSouth AfricanSouth AmericanSouth American IndianSoviet UnionSpaniardSpanishSpanish AmericanSpanish American IndianSri LankanSubsaharan AfricanSudaneseSwedishSwissSyrianTaiwaneseThaiTlingit-HaidaTohono O'OdhamTonganTrinidadian and TobagonianTsimshianTurkishU.S. Virgin IslanderUgandanUkrainianUruguayanUteVenezuelanVietnameseWelshWest IndianYakamaYaquiYugoslavianYumanYup'ikZimbabwean
Immigration
NonimmigrantsImmigrantsAfghanistanAfricaAlbaniaArgentinaArmeniaAsiaAustraliaAustriaBahamasBangladeshBarbadosBelarusBelgiumBelizeBoliviaBosnia and HerzegovinaBrazilBulgariaBurma/MyanmarCabo VerdeCambodiaCameroonCanadaCaribbeanCentral AmericaChileChinaColombiaCongoCosta RicaCroatiaCubaCzechoslovakiaDenmarkDominicaDominican RepublicEastern AfricaEastern AsiaEastern EuropeEcuadorEgyptEl SalvadorEnglandEritreaEthiopiaEuropeFijiFranceGermanyGhanaGreeceGrenadaGuatemalaGuyanaHaitiHondurasHong KongHungaryIndiaIndonesiaIranIraqIrelandIsraelItalyJamaicaJapanJordanKazakhstanKenyaKoreaKuwaitLaosLatin AmericaLatviaLebanonLiberiaLithuaniaMalaysiaMexicoMicronesiaMiddle AfricaMoldovaMoroccoNepalNetherlandsNicaraguaNigeriaNorth AmericaNorth MacedoniaNorthern AfricaNorthern EuropeNorwayOceaniaPakistanPanamaPeruPhilippinesPolandPortugalRomaniaRussiaSaudi ArabiaScotlandSenegalSerbiaSierra LeoneSingaporeSomaliaSouth AfricaSouth AmericaSouth Central AsiaSouth Eastern AsiaSouthern EuropeSpainSri LankaSt. Vincent and the GrenadinesSwedenSwitzerlandSyriaTaiwanThailandTrinidad and TobagoTurkeyUgandaUkraineUruguayUzbekistanVenezuelaVietnamWest IndiesWestern AfricaWestern AsiaWestern EuropeYemenZaireZimbabweAzores
Unemployment Among Ages 60 to 64 years
Income
Poverty
Unemployment
Labor Participation
Family Structure
Vehicle Availability
Education Level
Disability

Unemployment Among Ages 60 to 64 years Comparison

Immigrants from Sudan

Immigrants from Indonesia

Exceptional
Poor
4.5%
UNEMPLOYMENT AMONG AGES 60 TO 64 YEARS
100.0/ 100
METRIC RATING
41st/ 347
METRIC RANK
4.9%
UNEMPLOYMENT AMONG AGES 60 TO 64 YEARS
17.4/ 100
METRIC RATING
205th/ 347
METRIC RANK

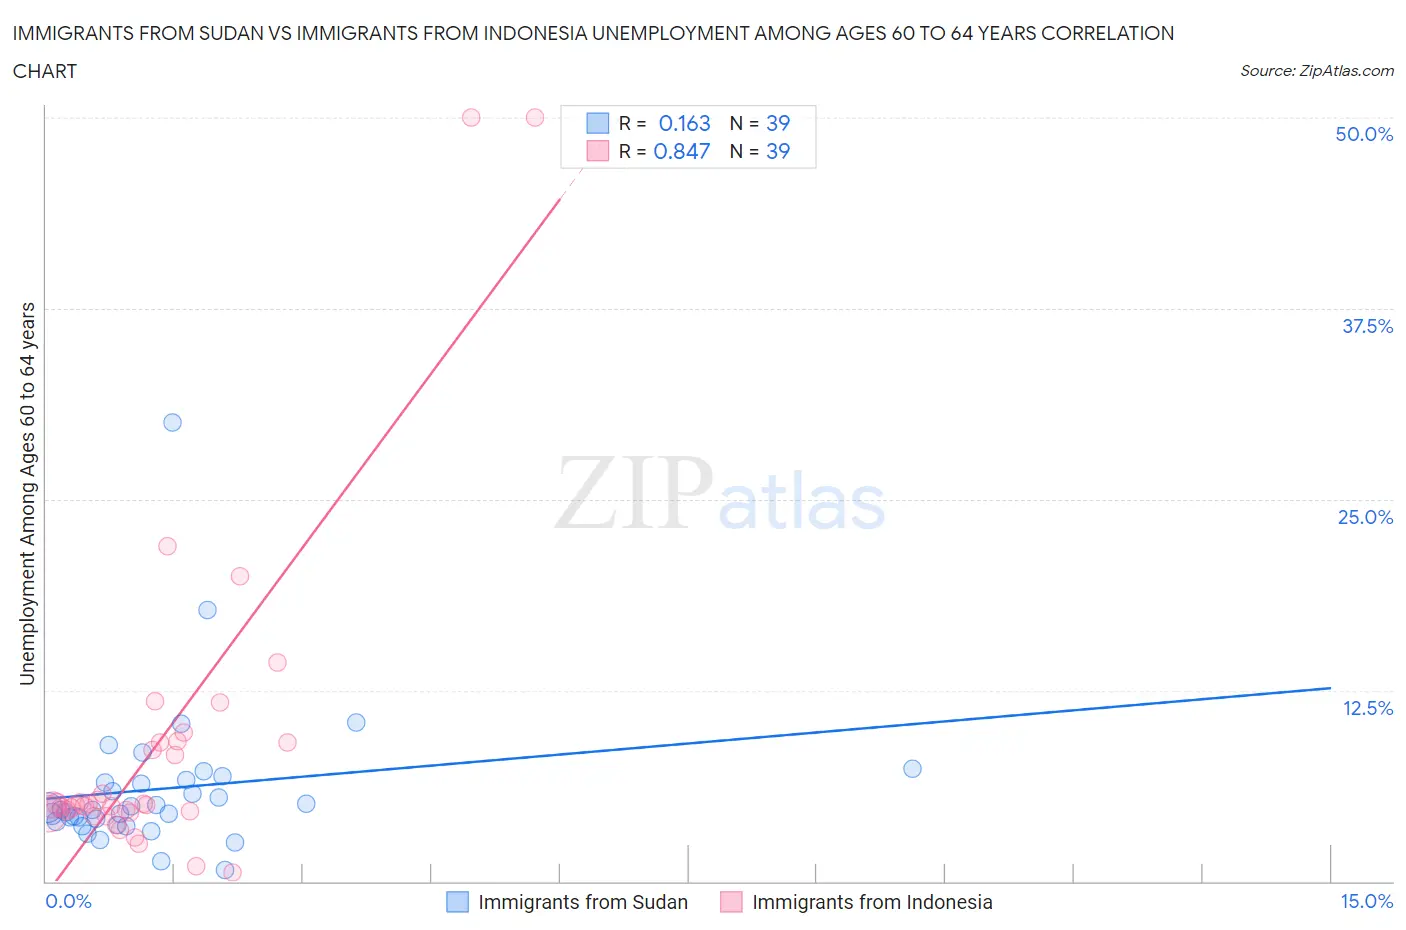
Immigrants from Sudan vs Immigrants from Indonesia Unemployment Among Ages 60 to 64 years Correlation Chart

The statistical analysis conducted on geographies consisting of 114,813,506 people shows a poor positive correlation between the proportion of Immigrants from Sudan and unemployment rate among population between the ages 60 and 64 in the United States with a correlation coefficient (R) of 0.163 and weighted average of 4.5%. Similarly, the statistical analysis conducted on geographies consisting of 206,250,939 people shows a very strong positive correlation between the proportion of Immigrants from Indonesia and unemployment rate among population between the ages 60 and 64 in the United States with a correlation coefficient (R) of 0.847 and weighted average of 4.9%, a difference of 9.2%.
Immigrants from Sudan vs Immigrants from Indonesia Unemployment Among Ages 60 to 64 years

Unemployment Among Ages 60 to 64 years Correlation Summary

MeasurementImmigrants from SudanImmigrants from Indonesia
Minimum0.70%0.60%
Maximum30.0%50.0%
Range29.3%49.4%
Mean6.1%8.8%
Median4.7%5.0%
Interquartile 25% (IQ1)4.0%4.5%
Interquartile 75% (IQ3)6.6%9.1%
Interquartile Range (IQR)2.7%4.6%
Standard Deviation (Sample)4.9%10.7%
Standard Deviation (Population)4.8%10.5%

Similar Demographics by Unemployment Among Ages 60 to 64 years

Demographics Similar to Immigrants from Sudan by Unemployment Among Ages 60 to 64 years

In terms of unemployment among ages 60 to 64 years, the demographic groups most similar to Immigrants from Sudan are English (4.5%, a difference of 0.050%), Scandinavian (4.5%, a difference of 0.13%), Swedish (4.5%, a difference of 0.22%), Native Hawaiian (4.5%, a difference of 0.27%), and Iraqi (4.5%, a difference of 0.27%).
DemographicsRating | RankUnemployment Among Ages 60 to 64 years
Belgians
100.0
/100
|
#34
Exceptional
4.5%
Germans
100.0
/100
|
#35
Exceptional
4.5%
Venezuelans
100.0
/100
|
#36
Exceptional
4.5%
Immigrants | Portugal
100.0
/100
|
#37
Exceptional
4.5%
Native Hawaiians
100.0
/100
|
#38
Exceptional
4.5%
Iraqis
100.0
/100
|
#39
Exceptional
4.5%
Scandinavians
100.0
/100
|
#40
Exceptional
4.5%
Immigrants | Sudan
100.0
/100
|
#41
Exceptional
4.5%
English
100.0
/100
|
#42
Exceptional
4.5%
Swedes
100.0
/100
|
#43
Exceptional
4.5%
Europeans
100.0
/100
|
#44
Exceptional
4.5%
Liberians
99.9
/100
|
#45
Exceptional
4.5%
Bhutanese
99.9
/100
|
#46
Exceptional
4.5%
Assyrians/Chaldeans/Syriacs
99.9
/100
|
#47
Exceptional
4.5%
Immigrants | Zimbabwe
99.9
/100
|
#48
Exceptional
4.6%

Demographics Similar to Immigrants from Indonesia by Unemployment Among Ages 60 to 64 years

In terms of unemployment among ages 60 to 64 years, the demographic groups most similar to Immigrants from Indonesia are New Zealander (4.9%, a difference of 0.0%), Chippewa (4.9%, a difference of 0.010%), German Russian (4.9%, a difference of 0.040%), Sierra Leonean (4.9%, a difference of 0.060%), and Russian (4.9%, a difference of 0.080%).
DemographicsRating | RankUnemployment Among Ages 60 to 64 years
Guamanians/Chamorros
23.7
/100
|
#198
Fair
4.9%
Immigrants | Vietnam
23.7
/100
|
#199
Fair
4.9%
Immigrants | Czechoslovakia
23.5
/100
|
#200
Fair
4.9%
Colombians
22.7
/100
|
#201
Fair
4.9%
Immigrants | Western Africa
20.6
/100
|
#202
Fair
4.9%
Uruguayans
19.9
/100
|
#203
Poor
4.9%
Russians
18.9
/100
|
#204
Poor
4.9%
Immigrants | Indonesia
17.4
/100
|
#205
Poor
4.9%
New Zealanders
17.4
/100
|
#206
Poor
4.9%
Chippewa
17.3
/100
|
#207
Poor
4.9%
German Russians
16.8
/100
|
#208
Poor
4.9%
Sierra Leoneans
16.5
/100
|
#209
Poor
4.9%
Cherokee
16.1
/100
|
#210
Poor
4.9%
Blackfeet
15.7
/100
|
#211
Poor
4.9%
Moroccans
15.0
/100
|
#212
Poor
4.9%