Immigrants from St. Vincent and the Grenadines vs South African Unemployment Among Ages 20 to 24 years
COMPARE
Immigrants from St. Vincent and the Grenadines
South African
Unemployment Among Ages 20 to 24 years
Unemployment Among Ages 20 to 24 years Comparison
Immigrants from St. Vincent and the Grenadines
South Africans
14.3%
UNEMPLOYMENT AMONG AGES 20 TO 24 YEARS
0.0/ 100
METRIC RATING
338th/ 347
METRIC RANK
10.1%
UNEMPLOYMENT AMONG AGES 20 TO 24 YEARS
87.8/ 100
METRIC RATING
121st/ 347
METRIC RANK
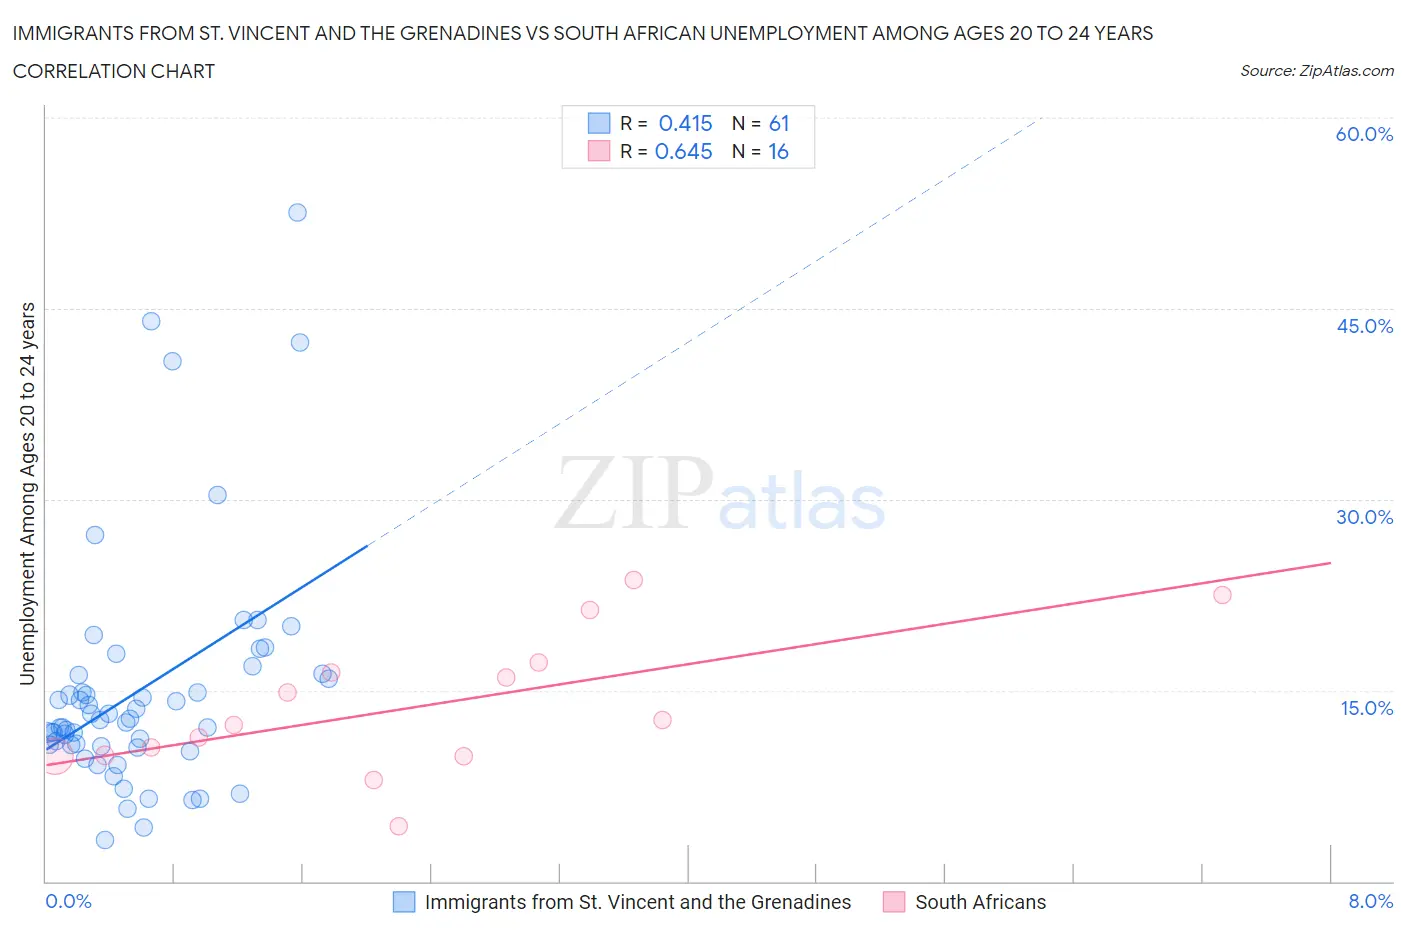
Immigrants from St. Vincent and the Grenadines vs South African Unemployment Among Ages 20 to 24 years Correlation Chart
The statistical analysis conducted on geographies consisting of 55,881,091 people shows a moderate positive correlation between the proportion of Immigrants from St. Vincent and the Grenadines and unemployment rate among population between the ages 20 and 24 in the United States with a correlation coefficient (R) of 0.415 and weighted average of 14.3%. Similarly, the statistical analysis conducted on geographies consisting of 179,868,071 people shows a significant positive correlation between the proportion of South Africans and unemployment rate among population between the ages 20 and 24 in the United States with a correlation coefficient (R) of 0.645 and weighted average of 10.1%, a difference of 41.7%.
Unemployment Among Ages 20 to 24 years Correlation Summary
| Measurement | Immigrants from St. Vincent and the Grenadines | South African |
| Minimum | 3.2% | 4.3% |
| Maximum | 52.5% | 23.7% |
| Range | 49.3% | 19.4% |
| Mean | 15.1% | 13.8% |
| Median | 12.7% | 12.4% |
| Interquartile 25% (IQ1) | 10.7% | 9.8% |
| Interquartile 75% (IQ3) | 16.3% | 16.8% |
| Interquartile Range (IQR) | 5.6% | 6.9% |
| Standard Deviation (Sample) | 9.4% | 5.5% |
| Standard Deviation (Population) | 9.3% | 5.3% |
Similar Demographics by Unemployment Among Ages 20 to 24 years
Demographics Similar to Immigrants from St. Vincent and the Grenadines by Unemployment Among Ages 20 to 24 years
In terms of unemployment among ages 20 to 24 years, the demographic groups most similar to Immigrants from St. Vincent and the Grenadines are Paiute (14.3%, a difference of 0.010%), Pima (14.2%, a difference of 1.1%), Sioux (14.2%, a difference of 1.3%), Guyanese (14.0%, a difference of 2.5%), and Immigrants from Guyana (13.9%, a difference of 3.0%).
| Demographics | Rating | Rank | Unemployment Among Ages 20 to 24 years |
| Aleuts | 0.0 /100 | #331 | Tragic 13.8% |
| Immigrants | Grenada | 0.0 /100 | #332 | Tragic 13.8% |
| Immigrants | Guyana | 0.0 /100 | #333 | Tragic 13.9% |
| Guyanese | 0.0 /100 | #334 | Tragic 14.0% |
| Sioux | 0.0 /100 | #335 | Tragic 14.2% |
| Pima | 0.0 /100 | #336 | Tragic 14.2% |
| Paiute | 0.0 /100 | #337 | Tragic 14.3% |
| Immigrants | St. Vincent and the Grenadines | 0.0 /100 | #338 | Tragic 14.3% |
| Immigrants | Yemen | 0.0 /100 | #339 | Tragic 14.9% |
| Yuman | 0.0 /100 | #340 | Tragic 15.8% |
| Navajo | 0.0 /100 | #341 | Tragic 16.1% |
| Puerto Ricans | 0.0 /100 | #342 | Tragic 16.7% |
| Tsimshian | 0.0 /100 | #343 | Tragic 18.0% |
| Crow | 0.0 /100 | #344 | Tragic 18.7% |
| Hopi | 0.0 /100 | #345 | Tragic 19.9% |
Demographics Similar to South Africans by Unemployment Among Ages 20 to 24 years
In terms of unemployment among ages 20 to 24 years, the demographic groups most similar to South Africans are Immigrants from Canada (10.1%, a difference of 0.030%), French (10.1%, a difference of 0.040%), White/Caucasian (10.1%, a difference of 0.040%), Immigrants from Iraq (10.1%, a difference of 0.060%), and Paraguayan (10.1%, a difference of 0.070%).
| Demographics | Rating | Rank | Unemployment Among Ages 20 to 24 years |
| Ottawa | 90.8 /100 | #114 | Exceptional 10.1% |
| Immigrants | Morocco | 90.5 /100 | #115 | Exceptional 10.1% |
| Basques | 89.8 /100 | #116 | Excellent 10.1% |
| Immigrants | Uruguay | 89.6 /100 | #117 | Excellent 10.1% |
| Paraguayans | 88.6 /100 | #118 | Excellent 10.1% |
| French | 88.2 /100 | #119 | Excellent 10.1% |
| Immigrants | Canada | 88.2 /100 | #120 | Excellent 10.1% |
| South Africans | 87.8 /100 | #121 | Excellent 10.1% |
| Whites/Caucasians | 87.4 /100 | #122 | Excellent 10.1% |
| Immigrants | Iraq | 87.1 /100 | #123 | Excellent 10.1% |
| Immigrants | Japan | 86.5 /100 | #124 | Excellent 10.1% |
| Spanish | 86.1 /100 | #125 | Excellent 10.1% |
| Jordanians | 86.1 /100 | #126 | Excellent 10.1% |
| Immigrants | Norway | 85.3 /100 | #127 | Excellent 10.1% |
| Immigrants | Brazil | 84.9 /100 | #128 | Excellent 10.1% |