Immigrants from Sri Lanka vs Yakama Unemployment Among Ages 65 to 74 years

COMPARE

Immigrants from Sri Lanka
Race
Ancestry
AfghanAfricanAlaska NativeAlaskan AthabascanAlbanianAleutAlsatianAmericanApacheArabArapahoArgentineanArmenianAssyrian/Chaldean/SyriacAustralianAustrianBahamianBangladeshiBarbadianBasqueBelgianBelizeanBermudanBhutaneseBlackfeetBolivianBrazilianBritishBritish West IndianBulgarianBurmeseCajunCambodianCanadianCape VerdeanCarpatho RusynCelticCentral AmericanCentral American IndianCherokeeCheyenneChickasawChileanChineseChippewaChoctawColombianColvilleComancheCosta RicanCreeCreekCroatianCrowCubanCypriotCzechCzechoslovakianDanishDelawareDominicanDutchDutch West IndianEastern EuropeanEcuadorianEgyptianEnglishEstonianEthiopianEuropeanFijianFilipinoFinnishFrenchFrench American IndianFrench CanadianGermanGerman RussianGhanaianGreekGuamanian/ChamorroGuatemalanGuyaneseHaitianHmongHonduranHopiHoumaHungarianIcelanderIndian (Asian)IndonesianInupiatIranianIraqiIrishIroquoisIsraeliItalianJamaicanJapaneseJordanianKenyanKiowaKoreanLaotianLatvianLebaneseLiberianLithuanianLumbeeLuxembourgerMacedonianMalaysianMalteseMarshalleseMenomineeMexicanMexican American IndianMongolianMoroccanNative HawaiianNavajoNepaleseNew ZealanderNicaraguanNigerianNorthern EuropeanNorwegianOkinawanOsageOttawaPaiutePakistaniPalestinianPanamanianParaguayanPennsylvania GermanPeruvianPimaPolishPortuguesePotawatomiPuebloPuerto RicanPuget Sound SalishRomanianRussianSalvadoranSamoanScandinavianScotch-IrishScottishSeminoleSenegaleseSerbianShoshoneSierra LeoneanSiouxSlavicSlovakSloveneSomaliSouth AfricanSouth AmericanSouth American IndianSoviet UnionSpaniardSpanishSpanish AmericanSpanish American IndianSri LankanSubsaharan AfricanSudaneseSwedishSwissSyrianTaiwaneseThaiTlingit-HaidaTohono O'OdhamTonganTrinidadian and TobagonianTsimshianTurkishU.S. Virgin IslanderUgandanUkrainianUruguayanUteVenezuelanVietnameseWelshWest IndianYaquiYugoslavianYumanYup'ikZimbabwean
Immigration
NonimmigrantsImmigrantsAfghanistanAfricaAlbaniaArgentinaArmeniaAsiaAustraliaAustriaBahamasBangladeshBarbadosBelarusBelgiumBelizeBoliviaBosnia and HerzegovinaBrazilBulgariaBurma/MyanmarCabo VerdeCambodiaCameroonCanadaCaribbeanCentral AmericaChileChinaColombiaCongoCosta RicaCroatiaCubaCzechoslovakiaDenmarkDominicaDominican RepublicEastern AfricaEastern AsiaEastern EuropeEcuadorEgyptEl SalvadorEnglandEritreaEthiopiaEuropeFijiFranceGermanyGhanaGreeceGrenadaGuatemalaGuyanaHaitiHondurasHong KongHungaryIndiaIndonesiaIranIraqIrelandIsraelItalyJamaicaJapanJordanKazakhstanKenyaKoreaKuwaitLaosLatin AmericaLatviaLebanonLiberiaLithuaniaMalaysiaMexicoMicronesiaMiddle AfricaMoldovaMoroccoNepalNetherlandsNicaraguaNigeriaNorth AmericaNorth MacedoniaNorthern AfricaNorthern EuropeNorwayOceaniaPakistanPanamaPeruPhilippinesPolandPortugalRomaniaRussiaSaudi ArabiaScotlandSenegalSerbiaSierra LeoneSingaporeSomaliaSouth AfricaSouth AmericaSouth Central AsiaSouth Eastern AsiaSouthern EuropeSpainSri LankaSt. Vincent and the GrenadinesSudanSwedenSwitzerlandSyriaTaiwanThailandTrinidad and TobagoTurkeyUgandaUkraineUruguayUzbekistanVenezuelaVietnamWest IndiesWestern AfricaWestern AsiaWestern EuropeYemenZaireZimbabweAzores
Yakama
Race
Ancestry
AfghanAfricanAlaska NativeAlaskan AthabascanAlbanianAleutAlsatianAmericanApacheArabArapahoArgentineanArmenianAssyrian/Chaldean/SyriacAustralianAustrianBahamianBangladeshiBarbadianBasqueBelgianBelizeanBermudanBhutaneseBlackfeetBolivianBrazilianBritishBritish West IndianBulgarianBurmeseCajunCambodianCanadianCape VerdeanCarpatho RusynCelticCentral AmericanCentral American IndianCherokeeCheyenneChickasawChileanChineseChippewaChoctawColombianColvilleComancheCosta RicanCreeCreekCroatianCrowCubanCypriotCzechCzechoslovakianDanishDelawareDominicanDutchDutch West IndianEastern EuropeanEcuadorianEgyptianEnglishEstonianEthiopianEuropeanFijianFilipinoFinnishFrenchFrench American IndianFrench CanadianGermanGerman RussianGhanaianGreekGuamanian/ChamorroGuatemalanGuyaneseHaitianHmongHonduranHopiHoumaHungarianIcelanderIndian (Asian)IndonesianInupiatIranianIraqiIrishIroquoisIsraeliItalianJamaicanJapaneseJordanianKenyanKiowaKoreanLaotianLatvianLebaneseLiberianLithuanianLumbeeLuxembourgerMacedonianMalaysianMalteseMarshalleseMenomineeMexicanMexican American IndianMongolianMoroccanNative HawaiianNavajoNepaleseNew ZealanderNicaraguanNigerianNorthern EuropeanNorwegianOkinawanOsageOttawaPaiutePakistaniPalestinianPanamanianParaguayanPennsylvania GermanPeruvianPimaPolishPortuguesePotawatomiPuebloPuerto RicanPuget Sound SalishRomanianRussianSalvadoranSamoanScandinavianScotch-IrishScottishSeminoleSenegaleseSerbianShoshoneSierra LeoneanSiouxSlavicSlovakSloveneSomaliSouth AfricanSouth AmericanSouth American IndianSoviet UnionSpaniardSpanishSpanish AmericanSpanish American IndianSri LankanSubsaharan AfricanSudaneseSwedishSwissSyrianTaiwaneseThaiTlingit-HaidaTohono O'OdhamTonganTrinidadian and TobagonianTsimshianTurkishU.S. Virgin IslanderUgandanUkrainianUruguayanUteVenezuelanVietnameseWelshWest IndianYakamaYaquiYugoslavianYumanYup'ikZimbabwean
Immigration
NonimmigrantsImmigrantsAfghanistanAfricaAlbaniaArgentinaArmeniaAsiaAustraliaAustriaBahamasBangladeshBarbadosBelarusBelgiumBelizeBoliviaBosnia and HerzegovinaBrazilBulgariaBurma/MyanmarCabo VerdeCambodiaCameroonCanadaCaribbeanCentral AmericaChileChinaColombiaCongoCosta RicaCroatiaCubaCzechoslovakiaDenmarkDominicaDominican RepublicEastern AfricaEastern AsiaEastern EuropeEcuadorEgyptEl SalvadorEnglandEritreaEthiopiaEuropeFijiFranceGermanyGhanaGreeceGrenadaGuatemalaGuyanaHaitiHondurasHong KongHungaryIndiaIndonesiaIranIraqIrelandIsraelItalyJamaicaJapanJordanKazakhstanKenyaKoreaKuwaitLaosLatin AmericaLatviaLebanonLiberiaLithuaniaMalaysiaMexicoMicronesiaMiddle AfricaMoldovaMoroccoNepalNetherlandsNicaraguaNigeriaNorth AmericaNorth MacedoniaNorthern AfricaNorthern EuropeNorwayOceaniaPakistanPanamaPeruPhilippinesPolandPortugalRomaniaRussiaSaudi ArabiaScotlandSenegalSerbiaSierra LeoneSingaporeSomaliaSouth AfricaSouth AmericaSouth Central AsiaSouth Eastern AsiaSouthern EuropeSpainSt. Vincent and the GrenadinesSudanSwedenSwitzerlandSyriaTaiwanThailandTrinidad and TobagoTurkeyUgandaUkraineUruguayUzbekistanVenezuelaVietnamWest IndiesWestern AfricaWestern AsiaWestern EuropeYemenZaireZimbabweAzores
Unemployment Among Ages 65 to 74 years
Income
Poverty
Unemployment
Labor Participation
Family Structure
Vehicle Availability
Education Level
Disability

Unemployment Among Ages 65 to 74 years Comparison

Immigrants from Sri Lanka

Yakama

Good
Tragic
5.3%
UNEMPLOYMENT AMONG AGES 65 TO 74 YEARS
73.8/ 100
METRIC RATING
148th/ 347
METRIC RANK
6.6%
UNEMPLOYMENT AMONG AGES 65 TO 74 YEARS
0.0/ 100
METRIC RATING
339th/ 347
METRIC RANK

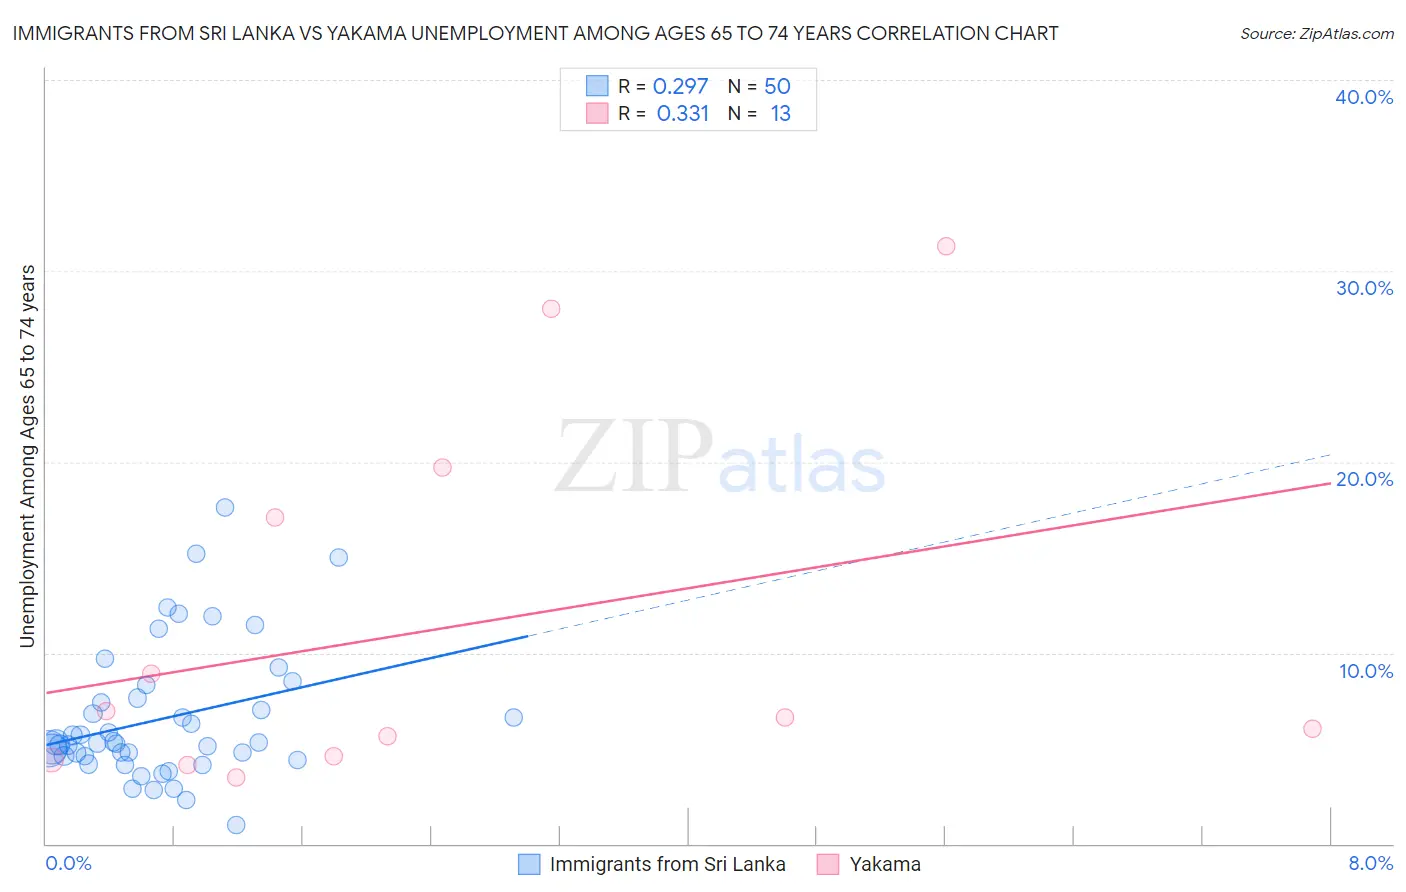
Immigrants from Sri Lanka vs Yakama Unemployment Among Ages 65 to 74 years Correlation Chart

The statistical analysis conducted on geographies consisting of 142,714,330 people shows a weak positive correlation between the proportion of Immigrants from Sri Lanka and unemployment rate among population between the ages 65 and 74 in the United States with a correlation coefficient (R) of 0.297 and weighted average of 5.3%. Similarly, the statistical analysis conducted on geographies consisting of 18,534,665 people shows a mild positive correlation between the proportion of Yakama and unemployment rate among population between the ages 65 and 74 in the United States with a correlation coefficient (R) of 0.331 and weighted average of 6.6%, a difference of 23.3%.
Immigrants from Sri Lanka vs Yakama Unemployment Among Ages 65 to 74 years

Unemployment Among Ages 65 to 74 years Correlation Summary

MeasurementImmigrants from Sri LankaYakama
Minimum1.0%3.5%
Maximum17.6%31.3%
Range16.6%27.8%
Mean6.6%11.3%
Median5.3%6.6%
Interquartile 25% (IQ1)4.6%4.5%
Interquartile 75% (IQ3)7.6%18.4%
Interquartile Range (IQR)3.1%13.9%
Standard Deviation (Sample)3.5%9.6%
Standard Deviation (Population)3.5%9.2%

Similar Demographics by Unemployment Among Ages 65 to 74 years

Demographics Similar to Immigrants from Sri Lanka by Unemployment Among Ages 65 to 74 years

In terms of unemployment among ages 65 to 74 years, the demographic groups most similar to Immigrants from Sri Lanka are Immigrants from Romania (5.3%, a difference of 0.010%), Immigrants from Poland (5.3%, a difference of 0.020%), Irish (5.3%, a difference of 0.040%), Immigrants from Latvia (5.3%, a difference of 0.040%), and Immigrants from Indonesia (5.3%, a difference of 0.040%).
DemographicsRating | RankUnemployment Among Ages 65 to 74 years
Immigrants | Asia
78.4
/100
|
#141
Good
5.3%
Turks
76.2
/100
|
#142
Good
5.3%
New Zealanders
76.1
/100
|
#143
Good
5.3%
Immigrants | Chile
76.0
/100
|
#144
Good
5.3%
Canadians
75.0
/100
|
#145
Good
5.3%
Irish
74.8
/100
|
#146
Good
5.3%
Immigrants | Latvia
74.6
/100
|
#147
Good
5.3%
Immigrants | Sri Lanka
73.8
/100
|
#148
Good
5.3%
Immigrants | Romania
73.5
/100
|
#149
Good
5.3%
Immigrants | Poland
73.2
/100
|
#150
Good
5.3%
Immigrants | Indonesia
72.9
/100
|
#151
Good
5.3%
Spanish
72.6
/100
|
#152
Good
5.3%
Immigrants | Cabo Verde
72.5
/100
|
#153
Good
5.3%
Poles
72.4
/100
|
#154
Good
5.3%
Immigrants | Cameroon
72.1
/100
|
#155
Good
5.3%

Demographics Similar to Yakama by Unemployment Among Ages 65 to 74 years

In terms of unemployment among ages 65 to 74 years, the demographic groups most similar to Yakama are Tlingit-Haida (6.5%, a difference of 0.36%), Ute (6.5%, a difference of 0.46%), Pima (6.6%, a difference of 0.84%), Immigrants from Armenia (6.5%, a difference of 1.2%), and Puerto Rican (6.4%, a difference of 2.8%).
DemographicsRating | RankUnemployment Among Ages 65 to 74 years
Immigrants | Dominican Republic
0.0
/100
|
#332
Tragic
6.3%
Paiute
0.0
/100
|
#333
Tragic
6.3%
Taiwanese
0.0
/100
|
#334
Tragic
6.3%
Puerto Ricans
0.0
/100
|
#335
Tragic
6.4%
Immigrants | Armenia
0.0
/100
|
#336
Tragic
6.5%
Ute
0.0
/100
|
#337
Tragic
6.5%
Tlingit-Haida
0.0
/100
|
#338
Tragic
6.5%
Yakama
0.0
/100
|
#339
Tragic
6.6%
Pima
0.0
/100
|
#340
Tragic
6.6%
Alaska Natives
0.0
/100
|
#341
Tragic
6.8%
Navajo
0.0
/100
|
#342
Tragic
6.9%
Alaskan Athabascans
0.0
/100
|
#343
Tragic
7.4%
Inupiat
0.0
/100
|
#344
Tragic
7.5%
Immigrants | Yemen
0.0
/100
|
#345
Tragic
8.3%
Yup'ik
0.0
/100
|
#346
Tragic
9.5%