Immigrants from Sri Lanka vs Belizean Female Unemployment
COMPARE
Immigrants from Sri Lanka
Belizean
Female Unemployment
Female Unemployment Comparison
Immigrants from Sri Lanka
Belizeans
5.1%
FEMALE UNEMPLOYMENT
85.0/ 100
METRIC RATING
132nd/ 347
METRIC RANK
6.3%
FEMALE UNEMPLOYMENT
0.0/ 100
METRIC RATING
313th/ 347
METRIC RANK
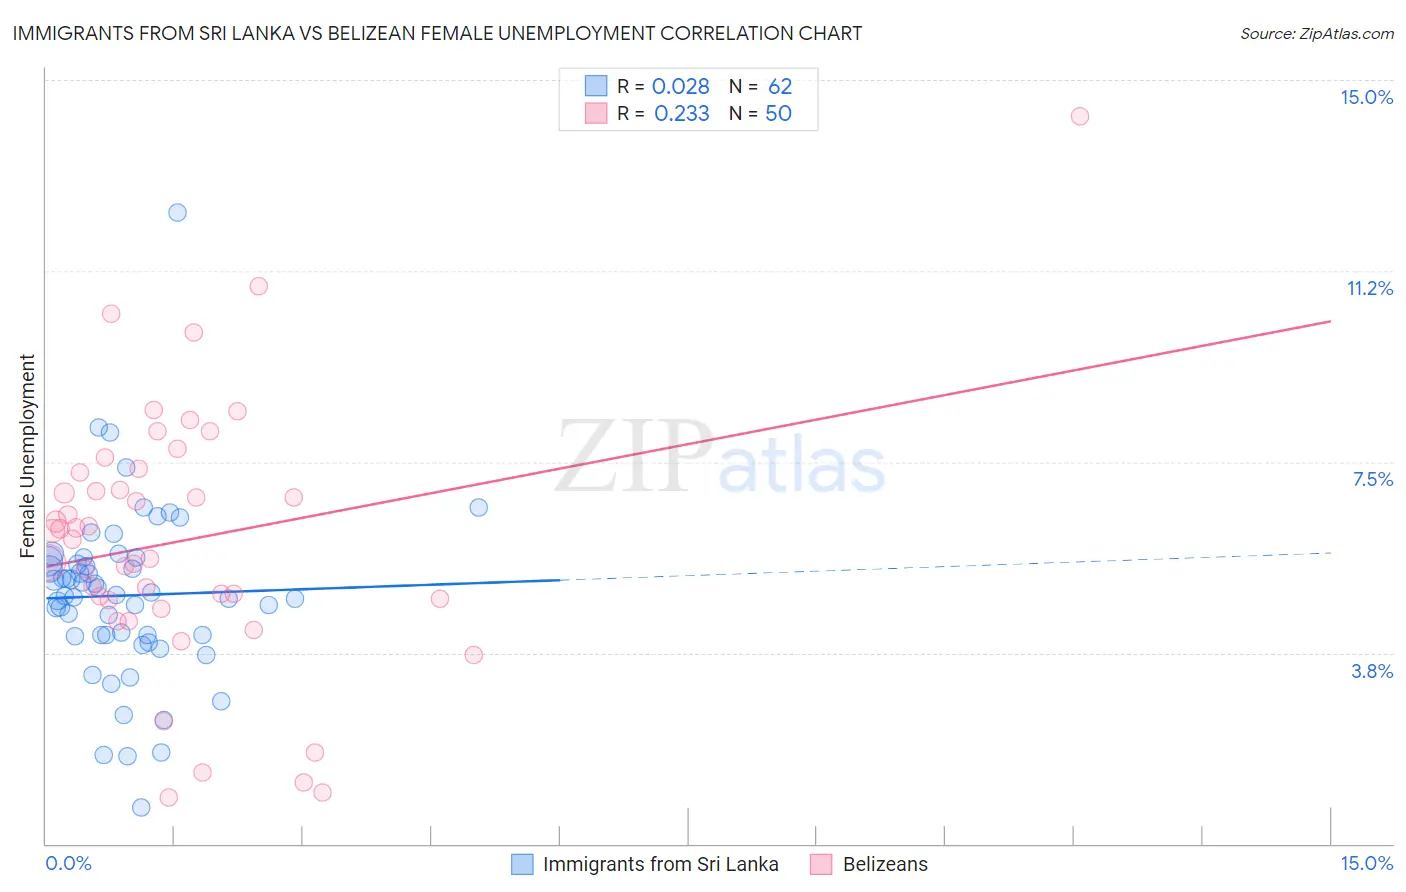
Immigrants from Sri Lanka vs Belizean Female Unemployment Correlation Chart
The statistical analysis conducted on geographies consisting of 149,603,268 people shows no correlation between the proportion of Immigrants from Sri Lanka and unemploymnet rate among females in the United States with a correlation coefficient (R) of 0.028 and weighted average of 5.1%. Similarly, the statistical analysis conducted on geographies consisting of 144,062,837 people shows a weak positive correlation between the proportion of Belizeans and unemploymnet rate among females in the United States with a correlation coefficient (R) of 0.233 and weighted average of 6.3%, a difference of 23.9%.
Female Unemployment Correlation Summary
| Measurement | Immigrants from Sri Lanka | Belizean |
| Minimum | 0.70% | 0.90% |
| Maximum | 12.4% | 14.3% |
| Range | 11.7% | 13.4% |
| Mean | 4.9% | 6.0% |
| Median | 4.9% | 6.1% |
| Interquartile 25% (IQ1) | 4.1% | 4.8% |
| Interquartile 75% (IQ3) | 5.5% | 7.3% |
| Interquartile Range (IQR) | 1.5% | 2.5% |
| Standard Deviation (Sample) | 1.7% | 2.6% |
| Standard Deviation (Population) | 1.7% | 2.5% |
Similar Demographics by Female Unemployment
Demographics Similar to Immigrants from Sri Lanka by Female Unemployment
In terms of female unemployment, the demographic groups most similar to Immigrants from Sri Lanka are Immigrants from Hong Kong (5.1%, a difference of 0.020%), Immigrants from Eritrea (5.1%, a difference of 0.040%), Immigrants from Ethiopia (5.1%, a difference of 0.050%), Immigrants from Latvia (5.1%, a difference of 0.050%), and Maltese (5.1%, a difference of 0.070%).
| Demographics | Rating | Rank | Female Unemployment |
| Basques | 86.5 /100 | #125 | Excellent 5.1% |
| Immigrants | Korea | 86.3 /100 | #126 | Excellent 5.1% |
| Immigrants | Hungary | 86.0 /100 | #127 | Excellent 5.1% |
| Chileans | 85.8 /100 | #128 | Excellent 5.1% |
| Ethiopians | 85.7 /100 | #129 | Excellent 5.1% |
| Maltese | 85.5 /100 | #130 | Excellent 5.1% |
| Immigrants | Ethiopia | 85.4 /100 | #131 | Excellent 5.1% |
| Immigrants | Sri Lanka | 85.0 /100 | #132 | Excellent 5.1% |
| Immigrants | Hong Kong | 84.8 /100 | #133 | Excellent 5.1% |
| Immigrants | Eritrea | 84.6 /100 | #134 | Excellent 5.1% |
| Immigrants | Latvia | 84.6 /100 | #135 | Excellent 5.1% |
| Indians (Asian) | 84.2 /100 | #136 | Excellent 5.1% |
| Pakistanis | 83.8 /100 | #137 | Excellent 5.1% |
| Chickasaw | 83.2 /100 | #138 | Excellent 5.1% |
| Immigrants | Eastern Asia | 83.0 /100 | #139 | Excellent 5.1% |
Demographics Similar to Belizeans by Female Unemployment
In terms of female unemployment, the demographic groups most similar to Belizeans are Immigrants from Grenada (6.3%, a difference of 0.010%), Immigrants from Ecuador (6.4%, a difference of 0.23%), Pueblo (6.4%, a difference of 0.54%), Immigrants from Mexico (6.3%, a difference of 0.67%), and Central American Indian (6.3%, a difference of 0.81%).
| Demographics | Rating | Rank | Female Unemployment |
| Immigrants | Central America | 0.0 /100 | #306 | Tragic 6.2% |
| Shoshone | 0.0 /100 | #307 | Tragic 6.2% |
| Hispanics or Latinos | 0.0 /100 | #308 | Tragic 6.2% |
| Ecuadorians | 0.0 /100 | #309 | Tragic 6.3% |
| Central American Indians | 0.0 /100 | #310 | Tragic 6.3% |
| Immigrants | Mexico | 0.0 /100 | #311 | Tragic 6.3% |
| Immigrants | Grenada | 0.0 /100 | #312 | Tragic 6.3% |
| Belizeans | 0.0 /100 | #313 | Tragic 6.3% |
| Immigrants | Ecuador | 0.0 /100 | #314 | Tragic 6.4% |
| Pueblo | 0.0 /100 | #315 | Tragic 6.4% |
| Houma | 0.0 /100 | #316 | Tragic 6.4% |
| Immigrants | St. Vincent and the Grenadines | 0.0 /100 | #317 | Tragic 6.4% |
| British West Indians | 0.0 /100 | #318 | Tragic 6.4% |
| Immigrants | Bangladesh | 0.0 /100 | #319 | Tragic 6.5% |
| Immigrants | Dominica | 0.0 /100 | #320 | Tragic 6.5% |