Immigrants from Spain vs Alaska Native Unemployment Among Seniors over 65 years

COMPARE

Immigrants from Spain
Race
Ancestry
AfghanAfricanAlaskan AthabascanAlbanianAleutAlsatianAmericanApacheArabArapahoArgentineanArmenianAssyrian/Chaldean/SyriacAustralianAustrianBahamianBangladeshiBarbadianBasqueBelgianBelizeanBermudanBhutaneseBlackfeetBolivianBrazilianBritishBritish West IndianBulgarianBurmeseCajunCambodianCanadianCape VerdeanCarpatho RusynCelticCentral AmericanCentral American IndianCherokeeCheyenneChickasawChileanChineseChippewaChoctawColombianColvilleComancheCosta RicanCreeCreekCroatianCrowCubanCypriotCzechCzechoslovakianDanishDelawareDominicanDutchDutch West IndianEastern EuropeanEcuadorianEgyptianEnglishEstonianEthiopianEuropeanFijianFilipinoFinnishFrenchFrench American IndianFrench CanadianGermanGerman RussianGhanaianGreekGuamanian/ChamorroGuatemalanGuyaneseHaitianHmongHonduranHopiHoumaHungarianIcelanderIndian (Asian)IndonesianInupiatIranianIraqiIrishIroquoisIsraeliItalianJamaicanJapaneseJordanianKenyanKiowaKoreanLaotianLatvianLebaneseLiberianLithuanianLumbeeLuxembourgerMacedonianMalaysianMalteseMarshalleseMenomineeMexicanMexican American IndianMongolianMoroccanNative HawaiianNavajoNepaleseNew ZealanderNicaraguanNigerianNorthern EuropeanNorwegianOkinawanOsageOttawaPaiutePakistaniPalestinianPanamanianParaguayanPennsylvania GermanPeruvianPimaPolishPortuguesePotawatomiPuebloPuerto RicanPuget Sound SalishRomanianRussianSalvadoranSamoanScandinavianScotch-IrishScottishSeminoleSenegaleseSerbianShoshoneSierra LeoneanSiouxSlavicSlovakSloveneSomaliSouth AfricanSouth AmericanSouth American IndianSoviet UnionSpaniardSpanishSpanish AmericanSpanish American IndianSri LankanSubsaharan AfricanSudaneseSwedishSwissSyrianTaiwaneseThaiTlingit-HaidaTohono O'OdhamTonganTrinidadian and TobagonianTsimshianTurkishU.S. Virgin IslanderUgandanUkrainianUruguayanUteVenezuelanVietnameseWelshWest IndianYakamaYaquiYugoslavianYumanYup'ikZimbabwean
Immigration
NonimmigrantsImmigrantsAfghanistanAfricaAlbaniaArgentinaArmeniaAsiaAustraliaAustriaBahamasBangladeshBarbadosBelarusBelgiumBelizeBoliviaBosnia and HerzegovinaBrazilBulgariaBurma/MyanmarCabo VerdeCambodiaCameroonCanadaCaribbeanCentral AmericaChileChinaColombiaCongoCosta RicaCroatiaCubaCzechoslovakiaDenmarkDominicaDominican RepublicEastern AfricaEastern AsiaEastern EuropeEcuadorEgyptEl SalvadorEnglandEritreaEthiopiaEuropeFijiFranceGermanyGhanaGreeceGrenadaGuatemalaGuyanaHaitiHondurasHong KongHungaryIndiaIndonesiaIranIraqIrelandIsraelItalyJamaicaJapanJordanKazakhstanKenyaKoreaKuwaitLaosLatin AmericaLatviaLebanonLiberiaLithuaniaMalaysiaMexicoMicronesiaMiddle AfricaMoldovaMoroccoNepalNetherlandsNicaraguaNigeriaNorth AmericaNorth MacedoniaNorthern AfricaNorthern EuropeNorwayOceaniaPakistanPanamaPeruPhilippinesPolandPortugalRomaniaRussiaSaudi ArabiaScotlandSenegalSerbiaSierra LeoneSingaporeSomaliaSouth AfricaSouth AmericaSouth Central AsiaSouth Eastern AsiaSouthern EuropeSpainSri LankaSt. Vincent and the GrenadinesSudanSwedenSwitzerlandSyriaTaiwanThailandTrinidad and TobagoTurkeyUgandaUkraineUruguayUzbekistanVenezuelaVietnamWest IndiesWestern AfricaWestern AsiaWestern EuropeYemenZaireZimbabweAzores
Alaska Native
Race
Ancestry
AfghanAfricanAlaska NativeAlaskan AthabascanAlbanianAleutAlsatianAmericanApacheArabArapahoArgentineanArmenianAssyrian/Chaldean/SyriacAustralianAustrianBahamianBangladeshiBarbadianBasqueBelgianBelizeanBermudanBhutaneseBlackfeetBolivianBrazilianBritishBritish West IndianBulgarianBurmeseCajunCambodianCanadianCape VerdeanCarpatho RusynCelticCentral AmericanCentral American IndianCherokeeCheyenneChickasawChileanChineseChippewaChoctawColombianColvilleComancheCosta RicanCreeCreekCroatianCrowCubanCypriotCzechCzechoslovakianDanishDelawareDominicanDutchDutch West IndianEastern EuropeanEcuadorianEgyptianEnglishEstonianEthiopianEuropeanFijianFilipinoFinnishFrenchFrench American IndianFrench CanadianGermanGerman RussianGhanaianGreekGuamanian/ChamorroGuatemalanGuyaneseHaitianHmongHonduranHopiHoumaHungarianIcelanderIndian (Asian)IndonesianInupiatIranianIraqiIrishIroquoisIsraeliItalianJamaicanJapaneseJordanianKenyanKiowaKoreanLaotianLatvianLebaneseLiberianLithuanianLumbeeLuxembourgerMacedonianMalaysianMalteseMarshalleseMenomineeMexicanMexican American IndianMongolianMoroccanNative HawaiianNavajoNepaleseNew ZealanderNicaraguanNigerianNorthern EuropeanNorwegianOkinawanOsageOttawaPaiutePakistaniPalestinianPanamanianParaguayanPennsylvania GermanPeruvianPimaPolishPortuguesePotawatomiPuebloPuerto RicanPuget Sound SalishRomanianRussianSalvadoranSamoanScandinavianScotch-IrishScottishSeminoleSenegaleseSerbianShoshoneSierra LeoneanSiouxSlavicSlovakSloveneSomaliSouth AfricanSouth AmericanSouth American IndianSoviet UnionSpaniardSpanishSpanish AmericanSpanish American IndianSri LankanSubsaharan AfricanSudaneseSwedishSwissSyrianTaiwaneseThaiTlingit-HaidaTohono O'OdhamTonganTrinidadian and TobagonianTsimshianTurkishU.S. Virgin IslanderUgandanUkrainianUruguayanUteVenezuelanVietnameseWelshWest IndianYakamaYaquiYugoslavianYumanYup'ikZimbabwean
Immigration
NonimmigrantsImmigrantsAfghanistanAfricaAlbaniaArgentinaArmeniaAsiaAustraliaAustriaBahamasBangladeshBarbadosBelarusBelgiumBelizeBoliviaBosnia and HerzegovinaBrazilBulgariaBurma/MyanmarCabo VerdeCambodiaCameroonCanadaCaribbeanCentral AmericaChileChinaColombiaCongoCosta RicaCroatiaCubaCzechoslovakiaDenmarkDominicaDominican RepublicEastern AfricaEastern AsiaEastern EuropeEcuadorEgyptEl SalvadorEnglandEritreaEthiopiaEuropeFijiFranceGermanyGhanaGreeceGrenadaGuatemalaGuyanaHaitiHondurasHong KongHungaryIndiaIndonesiaIranIraqIrelandIsraelItalyJamaicaJapanJordanKazakhstanKenyaKoreaKuwaitLaosLatin AmericaLatviaLebanonLiberiaLithuaniaMalaysiaMexicoMicronesiaMiddle AfricaMoldovaMoroccoNepalNetherlandsNicaraguaNigeriaNorth AmericaNorth MacedoniaNorthern AfricaNorthern EuropeNorwayOceaniaPakistanPanamaPeruPhilippinesPolandPortugalRomaniaRussiaSaudi ArabiaScotlandSenegalSerbiaSierra LeoneSingaporeSomaliaSouth AfricaSouth AmericaSouth Central AsiaSouth Eastern AsiaSouthern EuropeSri LankaSt. Vincent and the GrenadinesSudanSwedenSwitzerlandSyriaTaiwanThailandTrinidad and TobagoTurkeyUgandaUkraineUruguayUzbekistanVenezuelaVietnamWest IndiesWestern AfricaWestern AsiaWestern EuropeYemenZaireZimbabweAzores
Unemployment Among Seniors over 65 years
Income
Poverty
Unemployment
Labor Participation
Family Structure
Vehicle Availability
Education Level
Disability

Unemployment Among Seniors over 65 years Comparison

Immigrants from Spain

Alaska Natives

Average
Tragic
5.1%
UNEMPLOYMENT AMONG SENIORS OVER 65 YEARS
51.7/ 100
METRIC RATING
173rd/ 347
METRIC RANK
6.3%
UNEMPLOYMENT AMONG SENIORS OVER 65 YEARS
0.0/ 100
METRIC RATING
337th/ 347
METRIC RANK

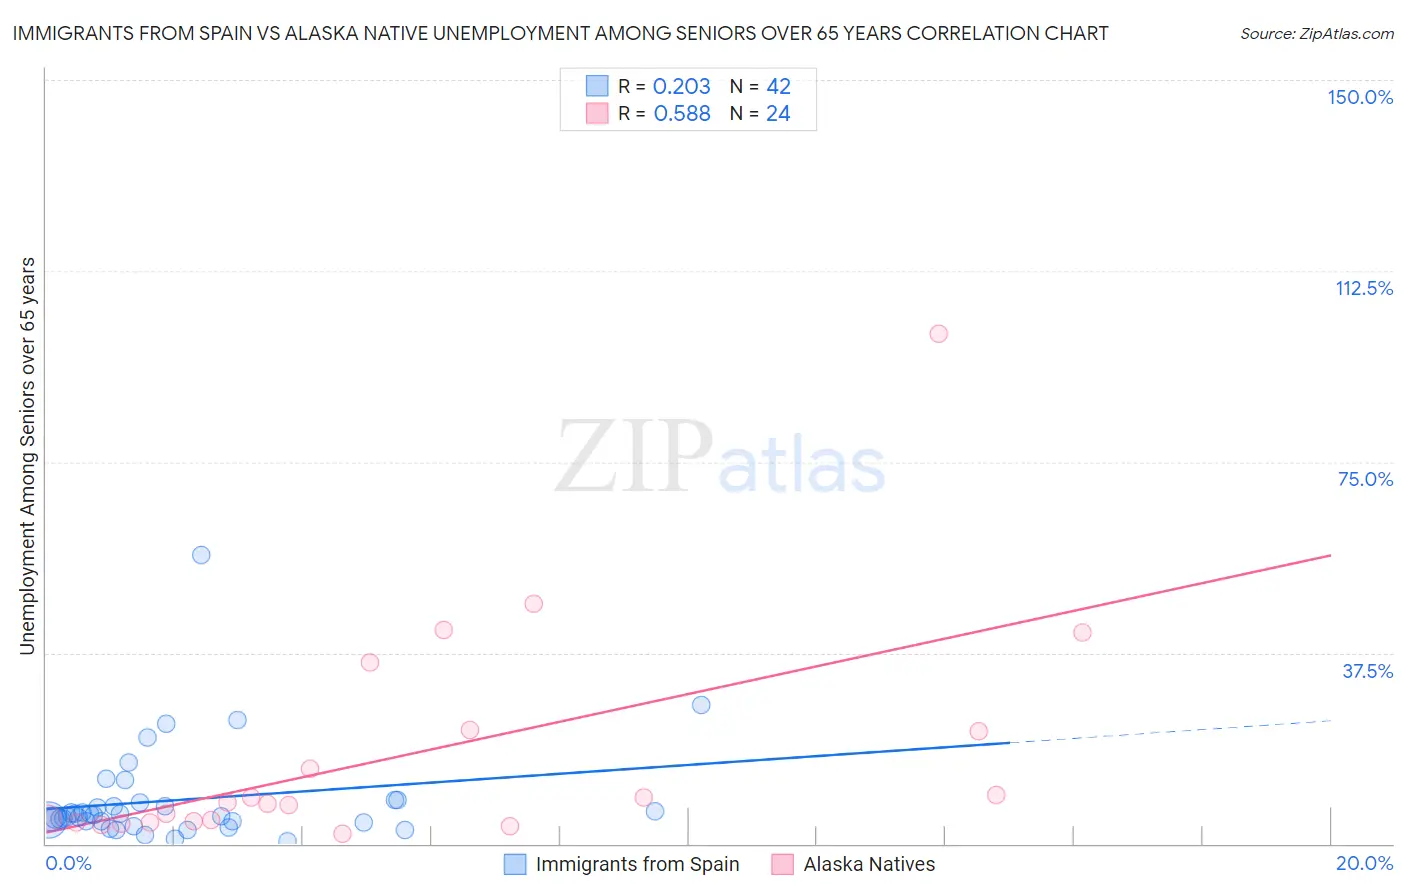
Immigrants from Spain vs Alaska Native Unemployment Among Seniors over 65 years Correlation Chart

The statistical analysis conducted on geographies consisting of 226,185,569 people shows a weak positive correlation between the proportion of Immigrants from Spain and unemployment rate amomg seniors over the age of 65 in the United States with a correlation coefficient (R) of 0.203 and weighted average of 5.1%. Similarly, the statistical analysis conducted on geographies consisting of 73,510,537 people shows a substantial positive correlation between the proportion of Alaska Natives and unemployment rate amomg seniors over the age of 65 in the United States with a correlation coefficient (R) of 0.588 and weighted average of 6.3%, a difference of 22.5%.
Immigrants from Spain vs Alaska Native Unemployment Among Seniors over 65 years

Unemployment Among Seniors over 65 years Correlation Summary

MeasurementImmigrants from SpainAlaska Native
Minimum0.40%1.9%
Maximum56.8%100.1%
Range56.4%98.2%
Mean8.6%17.4%
Median5.4%8.0%
Interquartile 25% (IQ1)4.3%4.3%
Interquartile 75% (IQ3)8.0%22.3%
Interquartile Range (IQR)3.7%18.0%
Standard Deviation (Sample)9.8%22.4%
Standard Deviation (Population)9.7%21.9%

Similar Demographics by Unemployment Among Seniors over 65 years

Demographics Similar to Immigrants from Spain by Unemployment Among Seniors over 65 years

In terms of unemployment among seniors over 65 years, the demographic groups most similar to Immigrants from Spain are Immigrants from Ireland (5.1%, a difference of 0.050%), Spanish American (5.1%, a difference of 0.050%), Immigrants from Eastern Europe (5.1%, a difference of 0.060%), Nonimmigrants (5.1%, a difference of 0.080%), and Immigrants from Eastern Asia (5.1%, a difference of 0.10%).
DemographicsRating | RankUnemployment Among Seniors over 65 years
Immigrants | Laos
63.8
/100
|
#166
Good
5.1%
Immigrants | Western Europe
60.4
/100
|
#167
Good
5.1%
Mongolians
59.8
/100
|
#168
Average
5.1%
Lithuanians
58.2
/100
|
#169
Average
5.1%
Immigrants | Eastern Asia
54.9
/100
|
#170
Average
5.1%
Immigrants | Nonimmigrants
54.1
/100
|
#171
Average
5.1%
Immigrants | Ireland
53.2
/100
|
#172
Average
5.1%
Immigrants | Spain
51.7
/100
|
#173
Average
5.1%
Spanish Americans
50.0
/100
|
#174
Average
5.1%
Immigrants | Eastern Europe
49.8
/100
|
#175
Average
5.1%
Indians (Asian)
46.6
/100
|
#176
Average
5.2%
Icelanders
45.9
/100
|
#177
Average
5.2%
Immigrants | Belgium
44.8
/100
|
#178
Average
5.2%
Immigrants | Somalia
44.0
/100
|
#179
Average
5.2%
Russians
43.6
/100
|
#180
Average
5.2%

Demographics Similar to Alaska Natives by Unemployment Among Seniors over 65 years

In terms of unemployment among seniors over 65 years, the demographic groups most similar to Alaska Natives are Immigrants from the Azores (6.3%, a difference of 0.17%), Paiute (6.3%, a difference of 0.44%), Ute (6.3%, a difference of 0.50%), Pima (6.3%, a difference of 0.55%), and Immigrants from Armenia (6.2%, a difference of 2.4%).
DemographicsRating | RankUnemployment Among Seniors over 65 years
Immigrants | Portugal
0.0
/100
|
#330
Tragic
6.0%
Taiwanese
0.0
/100
|
#331
Tragic
6.0%
Aleuts
0.0
/100
|
#332
Tragic
6.0%
Immigrants | Dominican Republic
0.0
/100
|
#333
Tragic
6.0%
Tohono O'odham
0.0
/100
|
#334
Tragic
6.1%
Immigrants | Armenia
0.0
/100
|
#335
Tragic
6.2%
Pima
0.0
/100
|
#336
Tragic
6.3%
Alaska Natives
0.0
/100
|
#337
Tragic
6.3%
Immigrants | Azores
0.0
/100
|
#338
Tragic
6.3%
Paiute
0.0
/100
|
#339
Tragic
6.3%
Ute
0.0
/100
|
#340
Tragic
6.3%
Yakama
0.0
/100
|
#341
Tragic
6.7%
Navajo
0.0
/100
|
#342
Tragic
6.7%
Tlingit-Haida
0.0
/100
|
#343
Tragic
6.8%
Alaskan Athabascans
0.0
/100
|
#344
Tragic
7.0%