Immigrants from South Central Asia vs Somali Unemployment Among Seniors over 65 years
COMPARE
Immigrants from South Central Asia
Somali
Unemployment Among Seniors over 65 years
Unemployment Among Seniors over 65 years Comparison
Immigrants from South Central Asia
Somalis
5.0%
UNEMPLOYMENT AMONG SENIORS OVER 65 YEARS
97.6/ 100
METRIC RATING
89th/ 347
METRIC RANK
5.2%
UNEMPLOYMENT AMONG SENIORS OVER 65 YEARS
33.5/ 100
METRIC RATING
187th/ 347
METRIC RANK
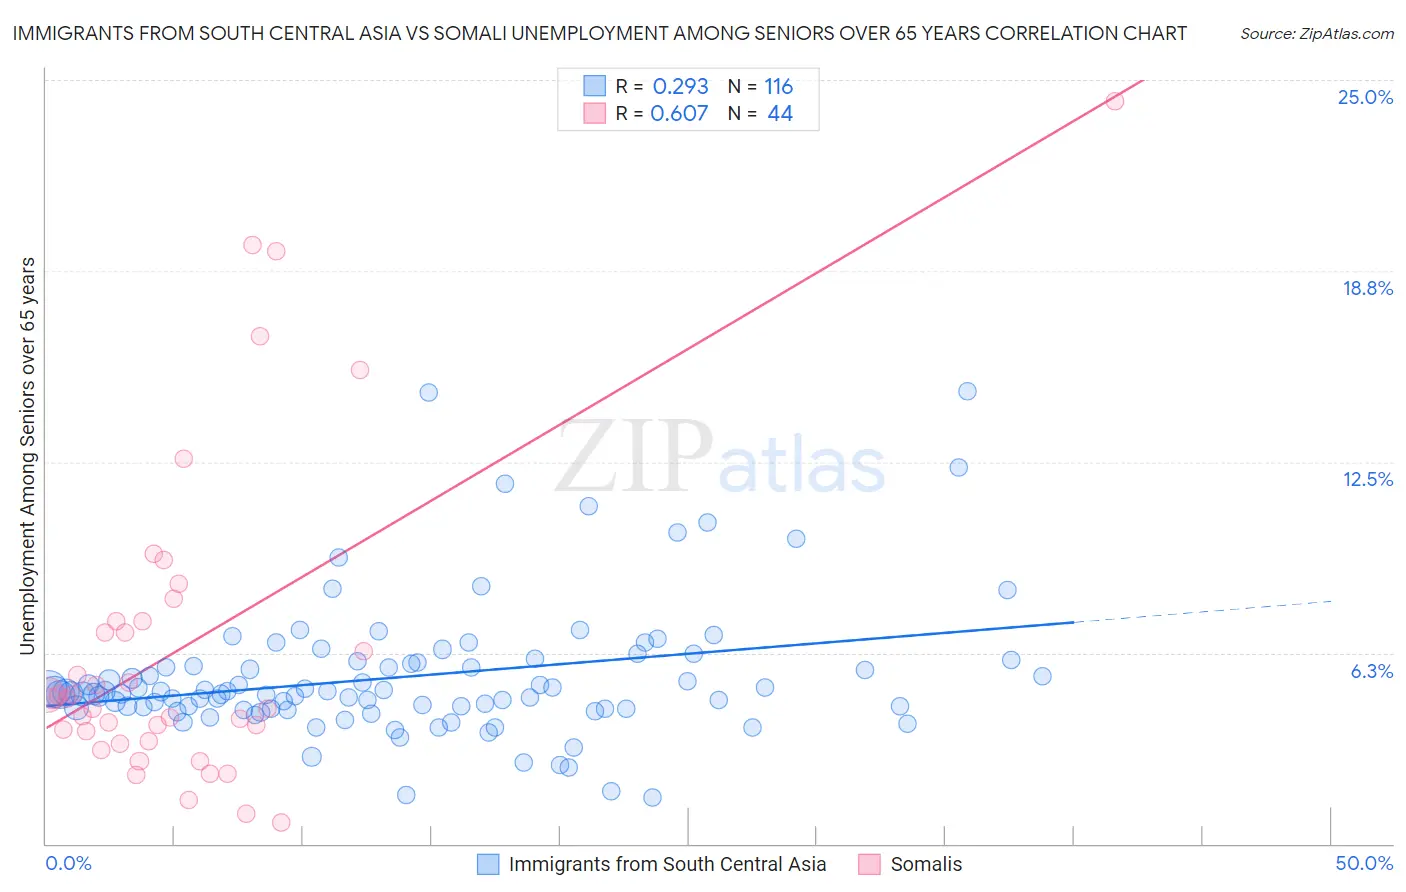
Immigrants from South Central Asia vs Somali Unemployment Among Seniors over 65 years Correlation Chart
The statistical analysis conducted on geographies consisting of 415,640,000 people shows a weak positive correlation between the proportion of Immigrants from South Central Asia and unemployment rate amomg seniors over the age of 65 in the United States with a correlation coefficient (R) of 0.293 and weighted average of 5.0%. Similarly, the statistical analysis conducted on geographies consisting of 94,958,941 people shows a significant positive correlation between the proportion of Somalis and unemployment rate amomg seniors over the age of 65 in the United States with a correlation coefficient (R) of 0.607 and weighted average of 5.2%, a difference of 3.6%.
Unemployment Among Seniors over 65 years Correlation Summary
| Measurement | Immigrants from South Central Asia | Somali |
| Minimum | 1.5% | 0.70% |
| Maximum | 14.8% | 24.3% |
| Range | 13.3% | 23.6% |
| Mean | 5.5% | 6.4% |
| Median | 4.9% | 4.8% |
| Interquartile 25% (IQ1) | 4.4% | 3.5% |
| Interquartile 75% (IQ3) | 5.9% | 7.3% |
| Interquartile Range (IQR) | 1.5% | 3.8% |
| Standard Deviation (Sample) | 2.2% | 5.2% |
| Standard Deviation (Population) | 2.2% | 5.2% |
Similar Demographics by Unemployment Among Seniors over 65 years
Demographics Similar to Immigrants from South Central Asia by Unemployment Among Seniors over 65 years
In terms of unemployment among seniors over 65 years, the demographic groups most similar to Immigrants from South Central Asia are Afghan (5.0%, a difference of 0.010%), Immigrants from South Africa (5.0%, a difference of 0.010%), Immigrants from Bolivia (5.0%, a difference of 0.090%), Immigrants from Bulgaria (5.0%, a difference of 0.11%), and Austrian (5.0%, a difference of 0.11%).
| Demographics | Rating | Rank | Unemployment Among Seniors over 65 years |
| Serbians | 98.4 /100 | #82 | Exceptional 5.0% |
| Immigrants | Zimbabwe | 98.3 /100 | #83 | Exceptional 5.0% |
| Filipinos | 98.3 /100 | #84 | Exceptional 5.0% |
| Immigrants | Hungary | 98.2 /100 | #85 | Exceptional 5.0% |
| Immigrants | Taiwan | 98.2 /100 | #86 | Exceptional 5.0% |
| Immigrants | Switzerland | 98.2 /100 | #87 | Exceptional 5.0% |
| Afghans | 97.6 /100 | #88 | Exceptional 5.0% |
| Immigrants | South Central Asia | 97.6 /100 | #89 | Exceptional 5.0% |
| Immigrants | South Africa | 97.6 /100 | #90 | Exceptional 5.0% |
| Immigrants | Bolivia | 97.3 /100 | #91 | Exceptional 5.0% |
| Immigrants | Bulgaria | 97.3 /100 | #92 | Exceptional 5.0% |
| Austrians | 97.3 /100 | #93 | Exceptional 5.0% |
| Burmese | 96.8 /100 | #94 | Exceptional 5.0% |
| Assyrians/Chaldeans/Syriacs | 96.8 /100 | #95 | Exceptional 5.0% |
| Immigrants | Singapore | 96.8 /100 | #96 | Exceptional 5.0% |
Demographics Similar to Somalis by Unemployment Among Seniors over 65 years
In terms of unemployment among seniors over 65 years, the demographic groups most similar to Somalis are Immigrants from Egypt (5.2%, a difference of 0.010%), Bangladeshi (5.2%, a difference of 0.050%), American (5.2%, a difference of 0.060%), Korean (5.2%, a difference of 0.070%), and Immigrants from Iran (5.2%, a difference of 0.090%).
| Demographics | Rating | Rank | Unemployment Among Seniors over 65 years |
| Russians | 43.6 /100 | #180 | Average 5.2% |
| Immigrants | Italy | 43.5 /100 | #181 | Average 5.2% |
| Panamanians | 43.0 /100 | #182 | Average 5.2% |
| Immigrants | Western Asia | 42.1 /100 | #183 | Average 5.2% |
| Immigrants | Serbia | 41.6 /100 | #184 | Average 5.2% |
| Immigrants | Iran | 36.0 /100 | #185 | Fair 5.2% |
| Americans | 35.1 /100 | #186 | Fair 5.2% |
| Somalis | 33.5 /100 | #187 | Fair 5.2% |
| Immigrants | Egypt | 33.2 /100 | #188 | Fair 5.2% |
| Bangladeshis | 32.3 /100 | #189 | Fair 5.2% |
| Koreans | 31.6 /100 | #190 | Fair 5.2% |
| Immigrants | Denmark | 31.0 /100 | #191 | Fair 5.2% |
| Sioux | 30.8 /100 | #192 | Fair 5.2% |
| Immigrants | Africa | 29.6 /100 | #193 | Fair 5.2% |
| Argentineans | 29.1 /100 | #194 | Fair 5.2% |