Immigrants from South Central Asia vs Immigrants from Philippines Unemployment Among Ages 65 to 74 years
COMPARE
Immigrants from South Central Asia
Immigrants from Philippines
Unemployment Among Ages 65 to 74 years
Unemployment Among Ages 65 to 74 years Comparison
Immigrants from South Central Asia
Immigrants from Philippines
5.3%
UNEMPLOYMENT AMONG AGES 65 TO 74 YEARS
92.4/ 100
METRIC RATING
112th/ 347
METRIC RANK
5.3%
UNEMPLOYMENT AMONG AGES 65 TO 74 YEARS
61.2/ 100
METRIC RATING
164th/ 347
METRIC RANK
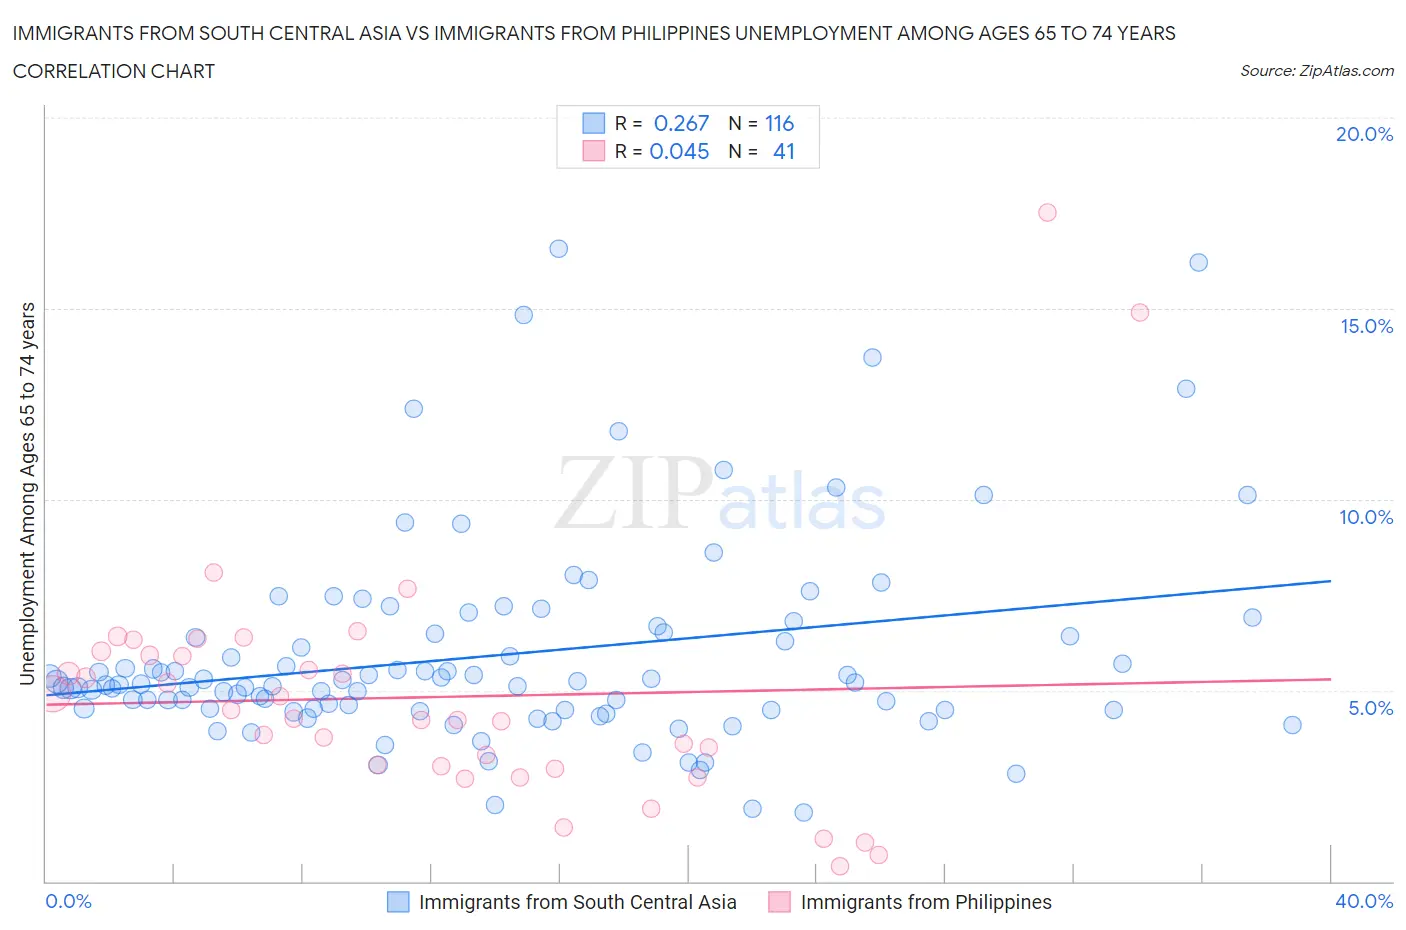
Immigrants from South Central Asia vs Immigrants from Philippines Unemployment Among Ages 65 to 74 years Correlation Chart
The statistical analysis conducted on geographies consisting of 404,148,963 people shows a weak positive correlation between the proportion of Immigrants from South Central Asia and unemployment rate among population between the ages 65 and 74 in the United States with a correlation coefficient (R) of 0.267 and weighted average of 5.3%. Similarly, the statistical analysis conducted on geographies consisting of 401,192,326 people shows no correlation between the proportion of Immigrants from Philippines and unemployment rate among population between the ages 65 and 74 in the United States with a correlation coefficient (R) of 0.045 and weighted average of 5.3%, a difference of 1.7%.
Unemployment Among Ages 65 to 74 years Correlation Summary
| Measurement | Immigrants from South Central Asia | Immigrants from Philippines |
| Minimum | 1.8% | 0.40% |
| Maximum | 16.6% | 17.5% |
| Range | 14.8% | 17.1% |
| Mean | 5.9% | 4.8% |
| Median | 5.2% | 4.3% |
| Interquartile 25% (IQ1) | 4.5% | 3.0% |
| Interquartile 75% (IQ3) | 6.5% | 6.0% |
| Interquartile Range (IQR) | 2.0% | 3.0% |
| Standard Deviation (Sample) | 2.7% | 3.2% |
| Standard Deviation (Population) | 2.7% | 3.2% |
Similar Demographics by Unemployment Among Ages 65 to 74 years
Demographics Similar to Immigrants from South Central Asia by Unemployment Among Ages 65 to 74 years
In terms of unemployment among ages 65 to 74 years, the demographic groups most similar to Immigrants from South Central Asia are Sri Lankan (5.3%, a difference of 0.040%), Immigrants from Germany (5.3%, a difference of 0.090%), Asian (5.3%, a difference of 0.14%), Immigrants from Bolivia (5.2%, a difference of 0.16%), and Immigrants from Turkey (5.3%, a difference of 0.17%).
| Demographics | Rating | Rank | Unemployment Among Ages 65 to 74 years |
| Iranians | 95.2 /100 | #105 | Exceptional 5.2% |
| Malaysians | 95.1 /100 | #106 | Exceptional 5.2% |
| Austrians | 94.5 /100 | #107 | Exceptional 5.2% |
| Immigrants | Malaysia | 94.1 /100 | #108 | Exceptional 5.2% |
| Immigrants | Singapore | 93.9 /100 | #109 | Exceptional 5.2% |
| Immigrants | Bolivia | 93.6 /100 | #110 | Exceptional 5.2% |
| Sri Lankans | 92.7 /100 | #111 | Exceptional 5.3% |
| Immigrants | South Central Asia | 92.4 /100 | #112 | Exceptional 5.3% |
| Immigrants | Germany | 91.6 /100 | #113 | Exceptional 5.3% |
| Asians | 91.1 /100 | #114 | Exceptional 5.3% |
| Immigrants | Turkey | 90.8 /100 | #115 | Exceptional 5.3% |
| Australians | 90.4 /100 | #116 | Exceptional 5.3% |
| Immigrants | Korea | 90.2 /100 | #117 | Exceptional 5.3% |
| Immigrants | Belarus | 90.1 /100 | #118 | Exceptional 5.3% |
| Immigrants | Fiji | 89.9 /100 | #119 | Excellent 5.3% |
Demographics Similar to Immigrants from Philippines by Unemployment Among Ages 65 to 74 years
In terms of unemployment among ages 65 to 74 years, the demographic groups most similar to Immigrants from Philippines are Mongolian (5.3%, a difference of 0.040%), Immigrants from Bosnia and Herzegovina (5.3%, a difference of 0.040%), Slovak (5.3%, a difference of 0.040%), Indian (Asian) (5.3%, a difference of 0.040%), and Immigrants from Eastern Asia (5.3%, a difference of 0.050%).
| Demographics | Rating | Rank | Unemployment Among Ages 65 to 74 years |
| Immigrants | Eastern Europe | 71.5 /100 | #157 | Good 5.3% |
| Immigrants | France | 71.0 /100 | #158 | Good 5.3% |
| Immigrants | Czechoslovakia | 66.3 /100 | #159 | Good 5.3% |
| Bangladeshis | 65.8 /100 | #160 | Good 5.3% |
| Immigrants | Italy | 63.7 /100 | #161 | Good 5.3% |
| Immigrants | Eastern Asia | 62.5 /100 | #162 | Good 5.3% |
| Mongolians | 62.3 /100 | #163 | Good 5.3% |
| Immigrants | Philippines | 61.2 /100 | #164 | Good 5.3% |
| Immigrants | Bosnia and Herzegovina | 60.2 /100 | #165 | Good 5.3% |
| Slovaks | 60.0 /100 | #166 | Good 5.3% |
| Indians (Asian) | 59.9 /100 | #167 | Average 5.3% |
| Whites/Caucasians | 57.2 /100 | #168 | Average 5.4% |
| Laotians | 55.7 /100 | #169 | Average 5.4% |
| Syrians | 53.7 /100 | #170 | Average 5.4% |
| Panamanians | 51.8 /100 | #171 | Average 5.4% |