Immigrants from South Central Asia vs Immigrants from Iran Unemployment Among Women with Children Under 6 years
COMPARE
Immigrants from South Central Asia
Immigrants from Iran
Unemployment Among Women with Children Under 6 years
Unemployment Among Women with Children Under 6 years Comparison
Immigrants from South Central Asia
Immigrants from Iran
6.6%
UNEMPLOYMENT AMONG WOMEN WITH CHILDREN UNDER 6 YEARS
100.0/ 100
METRIC RATING
34th/ 347
METRIC RANK
6.8%
UNEMPLOYMENT AMONG WOMEN WITH CHILDREN UNDER 6 YEARS
99.9/ 100
METRIC RATING
52nd/ 347
METRIC RANK
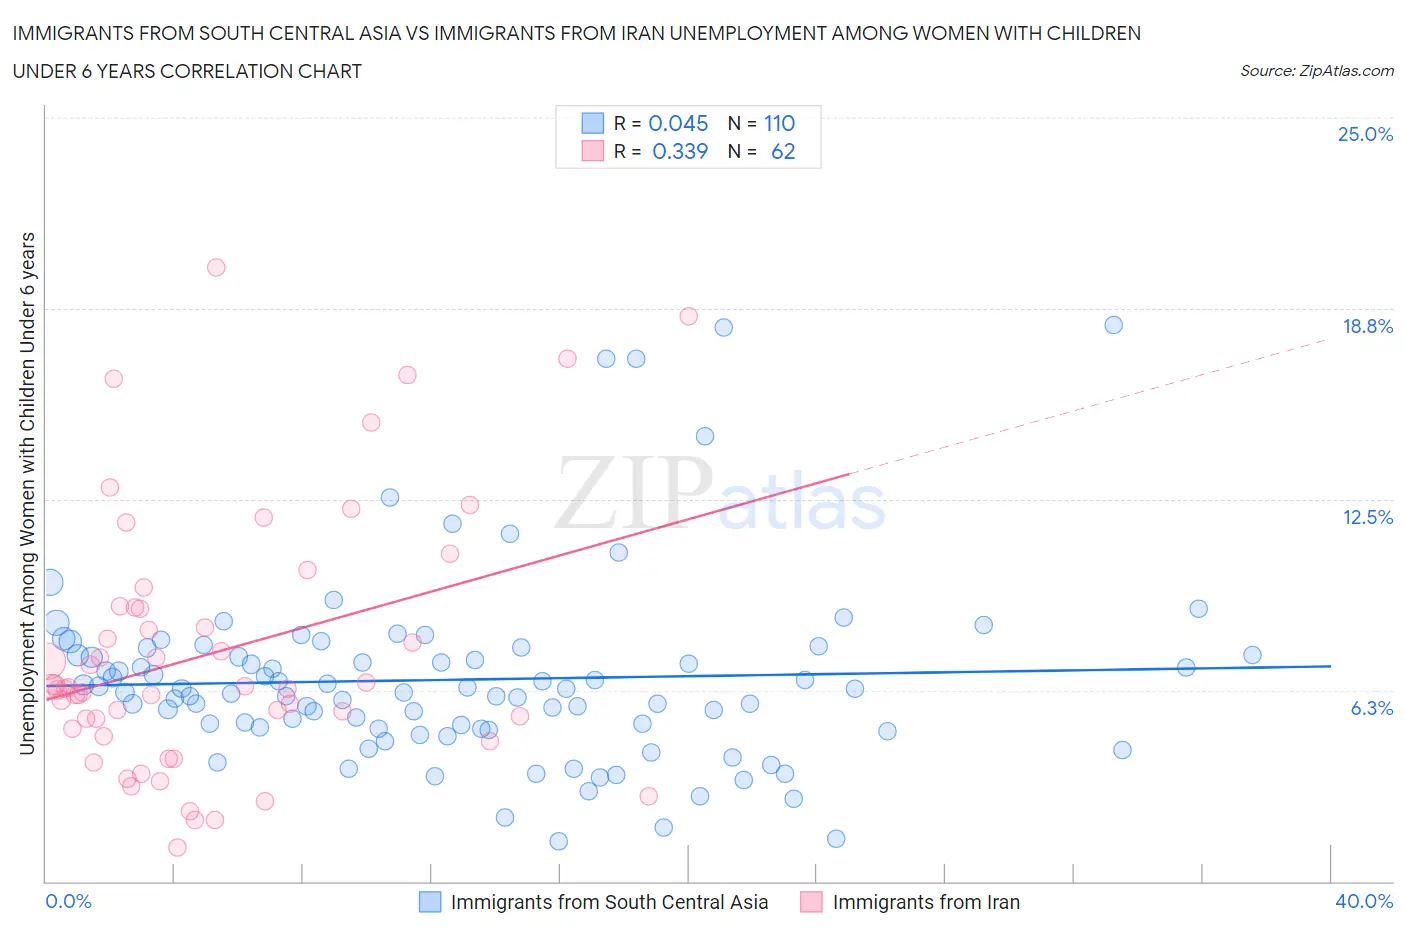
Immigrants from South Central Asia vs Immigrants from Iran Unemployment Among Women with Children Under 6 years Correlation Chart
The statistical analysis conducted on geographies consisting of 345,035,256 people shows no correlation between the proportion of Immigrants from South Central Asia and unemployment rate among women with children under the age of 6 in the United States with a correlation coefficient (R) of 0.045 and weighted average of 6.6%. Similarly, the statistical analysis conducted on geographies consisting of 227,826,017 people shows a mild positive correlation between the proportion of Immigrants from Iran and unemployment rate among women with children under the age of 6 in the United States with a correlation coefficient (R) of 0.339 and weighted average of 6.8%, a difference of 2.8%.
Unemployment Among Women with Children Under 6 years Correlation Summary
| Measurement | Immigrants from South Central Asia | Immigrants from Iran |
| Minimum | 1.3% | 1.1% |
| Maximum | 18.2% | 20.1% |
| Range | 16.9% | 19.0% |
| Mean | 6.6% | 7.5% |
| Median | 6.2% | 6.3% |
| Interquartile 25% (IQ1) | 5.0% | 5.0% |
| Interquartile 75% (IQ3) | 7.4% | 9.0% |
| Interquartile Range (IQR) | 2.4% | 4.0% |
| Standard Deviation (Sample) | 3.1% | 4.2% |
| Standard Deviation (Population) | 3.0% | 4.2% |
Demographics Similar to Immigrants from South Central Asia and Immigrants from Iran by Unemployment Among Women with Children Under 6 years
In terms of unemployment among women with children under 6 years, the demographic groups most similar to Immigrants from South Central Asia are Immigrants from Vietnam (6.6%, a difference of 0.010%), Yakama (6.6%, a difference of 0.27%), Luxembourger (6.6%, a difference of 0.34%), Sri Lankan (6.6%, a difference of 0.59%), and Hmong (6.7%, a difference of 0.72%). Similarly, the demographic groups most similar to Immigrants from Iran are Chinese (6.8%, a difference of 0.070%), Ethiopian (6.8%, a difference of 0.11%), Immigrants from Ireland (6.8%, a difference of 0.13%), Immigrants from Nepal (6.8%, a difference of 0.14%), and Immigrants from Switzerland (6.8%, a difference of 0.19%).
| Demographics | Rating | Rank | Unemployment Among Women with Children Under 6 years |
| Immigrants | Vietnam | 100.0 /100 | #33 | Exceptional 6.6% |
| Immigrants | South Central Asia | 100.0 /100 | #34 | Exceptional 6.6% |
| Yakama | 100.0 /100 | #35 | Exceptional 6.6% |
| Luxembourgers | 100.0 /100 | #36 | Exceptional 6.6% |
| Sri Lankans | 100.0 /100 | #37 | Exceptional 6.6% |
| Hmong | 100.0 /100 | #38 | Exceptional 6.7% |
| Immigrants | Russia | 100.0 /100 | #39 | Exceptional 6.7% |
| Asians | 100.0 /100 | #40 | Exceptional 6.7% |
| Immigrants | Indonesia | 99.9 /100 | #41 | Exceptional 6.7% |
| Immigrants | Cuba | 99.9 /100 | #42 | Exceptional 6.7% |
| Bhutanese | 99.9 /100 | #43 | Exceptional 6.7% |
| Iranians | 99.9 /100 | #44 | Exceptional 6.7% |
| Immigrants | Australia | 99.9 /100 | #45 | Exceptional 6.8% |
| Latvians | 99.9 /100 | #46 | Exceptional 6.8% |
| Immigrants | Asia | 99.9 /100 | #47 | Exceptional 6.8% |
| Immigrants | Switzerland | 99.9 /100 | #48 | Exceptional 6.8% |
| Immigrants | Nepal | 99.9 /100 | #49 | Exceptional 6.8% |
| Immigrants | Ireland | 99.9 /100 | #50 | Exceptional 6.8% |
| Ethiopians | 99.9 /100 | #51 | Exceptional 6.8% |
| Immigrants | Iran | 99.9 /100 | #52 | Exceptional 6.8% |
| Chinese | 99.9 /100 | #53 | Exceptional 6.8% |