Immigrants from South Central Asia vs Alsatian Unemployment Among Seniors over 75 years

COMPARE

Immigrants from South Central Asia
Race
Ancestry
AfghanAfricanAlaska NativeAlaskan AthabascanAlbanianAleutAmericanApacheArabArapahoArgentineanArmenianAssyrian/Chaldean/SyriacAustralianAustrianBahamianBangladeshiBarbadianBasqueBelgianBelizeanBermudanBhutaneseBlackfeetBolivianBrazilianBritishBritish West IndianBulgarianBurmeseCajunCambodianCanadianCape VerdeanCarpatho RusynCelticCentral AmericanCentral American IndianCherokeeCheyenneChickasawChileanChineseChippewaChoctawColombianColvilleComancheCosta RicanCreeCreekCroatianCrowCubanCypriotCzechCzechoslovakianDanishDelawareDominicanDutchDutch West IndianEastern EuropeanEcuadorianEgyptianEnglishEstonianEthiopianEuropeanFijianFilipinoFinnishFrenchFrench American IndianFrench CanadianGermanGerman RussianGhanaianGreekGuamanian/ChamorroGuatemalanGuyaneseHaitianHmongHonduranHopiHoumaHungarianIcelanderIndian (Asian)IndonesianInupiatIranianIraqiIrishIroquoisIsraeliItalianJamaicanJapaneseJordanianKenyanKiowaKoreanLaotianLatvianLebaneseLiberianLithuanianLumbeeLuxembourgerMacedonianMalaysianMalteseMarshalleseMexicanMexican American IndianMongolianMoroccanNative HawaiianNavajoNepaleseNew ZealanderNicaraguanNigerianNorthern EuropeanNorwegianOkinawanOsageOttawaPaiutePakistaniPalestinianPanamanianParaguayanPennsylvania GermanPeruvianPimaPolishPortuguesePotawatomiPuebloPuerto RicanPuget Sound SalishRomanianRussianSalvadoranSamoanScandinavianScotch-IrishScottishSeminoleSenegaleseSerbianShoshoneSierra LeoneanSiouxSlavicSlovakSloveneSomaliSouth AfricanSouth AmericanSouth American IndianSoviet UnionSpaniardSpanishSpanish AmericanSpanish American IndianSri LankanSubsaharan AfricanSudaneseSwedishSwissSyrianTaiwaneseThaiTlingit-HaidaTohono O'OdhamTonganTrinidadian and TobagonianTsimshianTurkishU.S. Virgin IslanderUgandanUkrainianUruguayanUteVenezuelanVietnameseWelshWest IndianYakamaYaquiYugoslavianYumanYup'ikZimbabwean
Immigration
NonimmigrantsImmigrantsAfghanistanAfricaAlbaniaArgentinaArmeniaAsiaAustraliaAustriaBahamasBangladeshBarbadosBelarusBelgiumBelizeBoliviaBosnia and HerzegovinaBrazilBulgariaBurma/MyanmarCabo VerdeCambodiaCameroonCanadaCaribbeanCentral AmericaChileChinaColombiaCongoCosta RicaCroatiaCubaCzechoslovakiaDenmarkDominicaDominican RepublicEastern AfricaEastern AsiaEastern EuropeEcuadorEgyptEl SalvadorEnglandEritreaEthiopiaEuropeFijiFranceGermanyGhanaGreeceGrenadaGuatemalaGuyanaHaitiHondurasHong KongHungaryIndiaIndonesiaIranIraqIrelandIsraelItalyJamaicaJapanJordanKazakhstanKenyaKoreaKuwaitLaosLatin AmericaLatviaLebanonLiberiaLithuaniaMalaysiaMexicoMicronesiaMiddle AfricaMoldovaMoroccoNepalNetherlandsNicaraguaNigeriaNorth AmericaNorth MacedoniaNorthern AfricaNorthern EuropeNorwayOceaniaPakistanPanamaPeruPhilippinesPolandPortugalRomaniaRussiaSaudi ArabiaScotlandSenegalSerbiaSierra LeoneSingaporeSomaliaSouth AfricaSouth AmericaSouth Central AsiaSouth Eastern AsiaSouthern EuropeSpainSri LankaSt. Vincent and the GrenadinesSudanSwedenSwitzerlandSyriaTaiwanThailandTrinidad and TobagoTurkeyUgandaUkraineUruguayUzbekistanVenezuelaVietnamWest IndiesWestern AfricaWestern AsiaWestern EuropeYemenZaireZimbabweAzores
Alsatian
Race
Ancestry
AfghanAfricanAlaska NativeAlaskan AthabascanAlbanianAleutAlsatianAmericanApacheArabArapahoArgentineanArmenianAssyrian/Chaldean/SyriacAustralianAustrianBahamianBangladeshiBarbadianBasqueBelgianBelizeanBermudanBhutaneseBlackfeetBolivianBrazilianBritishBritish West IndianBulgarianBurmeseCajunCambodianCanadianCape VerdeanCarpatho RusynCelticCentral AmericanCentral American IndianCherokeeCheyenneChickasawChileanChineseChippewaChoctawColombianColvilleComancheCosta RicanCreeCreekCroatianCrowCubanCypriotCzechCzechoslovakianDanishDelawareDominicanDutchDutch West IndianEastern EuropeanEcuadorianEgyptianEnglishEstonianEthiopianEuropeanFijianFilipinoFinnishFrenchFrench American IndianFrench CanadianGermanGerman RussianGhanaianGreekGuamanian/ChamorroGuatemalanGuyaneseHaitianHmongHonduranHopiHoumaHungarianIcelanderIndian (Asian)IndonesianInupiatIranianIraqiIrishIroquoisIsraeliItalianJamaicanJapaneseJordanianKenyanKiowaKoreanLaotianLatvianLebaneseLiberianLithuanianLumbeeLuxembourgerMacedonianMalaysianMalteseMarshalleseMexicanMexican American IndianMongolianMoroccanNative HawaiianNavajoNepaleseNew ZealanderNicaraguanNigerianNorthern EuropeanNorwegianOkinawanOsageOttawaPaiutePakistaniPalestinianPanamanianParaguayanPennsylvania GermanPeruvianPimaPolishPortuguesePotawatomiPuebloPuerto RicanPuget Sound SalishRomanianRussianSalvadoranSamoanScandinavianScotch-IrishScottishSeminoleSenegaleseSerbianShoshoneSierra LeoneanSiouxSlavicSlovakSloveneSomaliSouth AfricanSouth AmericanSouth American IndianSoviet UnionSpaniardSpanishSpanish AmericanSpanish American IndianSri LankanSubsaharan AfricanSudaneseSwedishSwissSyrianTaiwaneseThaiTlingit-HaidaTohono O'OdhamTonganTrinidadian and TobagonianTsimshianTurkishU.S. Virgin IslanderUgandanUkrainianUruguayanUteVenezuelanVietnameseWelshWest IndianYakamaYaquiYugoslavianYumanYup'ikZimbabwean
Immigration
NonimmigrantsImmigrantsAfghanistanAfricaAlbaniaArgentinaArmeniaAsiaAustraliaAustriaBahamasBangladeshBarbadosBelarusBelgiumBelizeBoliviaBosnia and HerzegovinaBrazilBulgariaBurma/MyanmarCabo VerdeCambodiaCameroonCanadaCaribbeanCentral AmericaChileChinaColombiaCongoCosta RicaCroatiaCubaCzechoslovakiaDenmarkDominicaDominican RepublicEastern AfricaEastern AsiaEastern EuropeEcuadorEgyptEl SalvadorEnglandEritreaEthiopiaEuropeFijiFranceGermanyGhanaGreeceGrenadaGuatemalaGuyanaHaitiHondurasHong KongHungaryIndiaIndonesiaIranIraqIrelandIsraelItalyJamaicaJapanJordanKazakhstanKenyaKoreaKuwaitLaosLatin AmericaLatviaLebanonLiberiaLithuaniaMalaysiaMexicoMicronesiaMiddle AfricaMoldovaMoroccoNepalNetherlandsNicaraguaNigeriaNorth AmericaNorth MacedoniaNorthern AfricaNorthern EuropeNorwayOceaniaPakistanPanamaPeruPhilippinesPolandPortugalRomaniaRussiaSaudi ArabiaScotlandSenegalSerbiaSierra LeoneSingaporeSomaliaSouth AfricaSouth AmericaSouth Eastern AsiaSouthern EuropeSpainSri LankaSt. Vincent and the GrenadinesSudanSwedenSwitzerlandSyriaTaiwanThailandTrinidad and TobagoTurkeyUgandaUkraineUruguayUzbekistanVenezuelaVietnamWest IndiesWestern AfricaWestern AsiaWestern EuropeYemenZaireZimbabweAzores
Unemployment Among Seniors over 75 years
Income
Poverty
Unemployment
Labor Participation
Family Structure
Vehicle Availability
Education Level
Disability

Unemployment Among Seniors over 75 years Comparison

Immigrants from South Central Asia

Alsatians

Exceptional
Exceptional
8.2%
UNEMPLOYMENT AMONG SENIORS OVER 75 YEARS
99.0/ 100
METRIC RATING
104th/ 347
METRIC RANK
6.1%
UNEMPLOYMENT AMONG SENIORS OVER 75 YEARS
100.0/ 100
METRIC RATING
4th/ 347
METRIC RANK

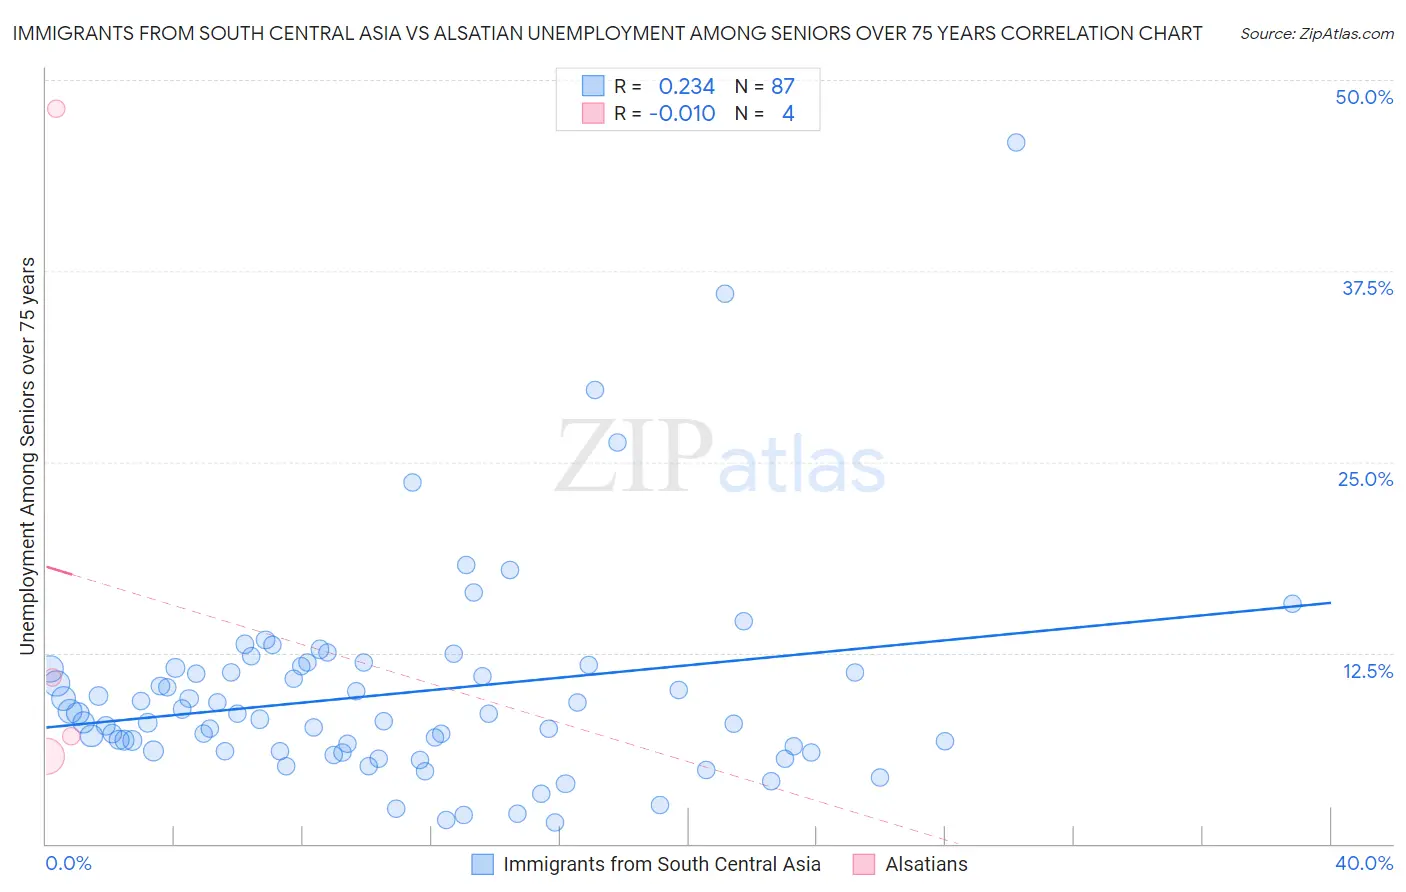
Immigrants from South Central Asia vs Alsatian Unemployment Among Seniors over 75 years Correlation Chart

The statistical analysis conducted on geographies consisting of 222,090,322 people shows a weak positive correlation between the proportion of Immigrants from South Central Asia and unemployment rate among seniors over the age of 75 in the United States with a correlation coefficient (R) of 0.234 and weighted average of 8.2%. Similarly, the statistical analysis conducted on geographies consisting of 64,928,583 people shows no correlation between the proportion of Alsatians and unemployment rate among seniors over the age of 75 in the United States with a correlation coefficient (R) of -0.010 and weighted average of 6.1%, a difference of 34.2%.
Immigrants from South Central Asia vs Alsatian Unemployment Among Seniors over 75 years

Unemployment Among Seniors over 75 years Correlation Summary

MeasurementImmigrants from South Central AsiaAlsatian
Minimum1.4%5.7%
Maximum45.9%48.1%
Range44.5%42.4%
Mean9.8%17.9%
Median8.5%8.9%
Interquartile 25% (IQ1)6.1%6.4%
Interquartile 75% (IQ3)11.5%29.5%
Interquartile Range (IQR)5.4%23.1%
Standard Deviation (Sample)6.9%20.2%
Standard Deviation (Population)6.8%17.5%

Similar Demographics by Unemployment Among Seniors over 75 years

Demographics Similar to Immigrants from South Central Asia by Unemployment Among Seniors over 75 years

In terms of unemployment among seniors over 75 years, the demographic groups most similar to Immigrants from South Central Asia are Immigrants from Caribbean (8.2%, a difference of 0.020%), Immigrants from Honduras (8.2%, a difference of 0.020%), South American Indian (8.2%, a difference of 0.030%), Immigrants from Panama (8.2%, a difference of 0.18%), and Sri Lankan (8.2%, a difference of 0.19%).
DemographicsRating | RankUnemployment Among Seniors over 75 years
Immigrants | Sri Lanka
99.3
/100
|
#97
Exceptional
8.2%
Immigrants | Northern Africa
99.3
/100
|
#98
Exceptional
8.2%
Burmese
99.2
/100
|
#99
Exceptional
8.2%
Immigrants | Kazakhstan
99.2
/100
|
#100
Exceptional
8.2%
Immigrants | Serbia
99.2
/100
|
#101
Exceptional
8.2%
Immigrants | Panama
99.1
/100
|
#102
Exceptional
8.2%
South American Indians
99.1
/100
|
#103
Exceptional
8.2%
Immigrants | South Central Asia
99.0
/100
|
#104
Exceptional
8.2%
Immigrants | Caribbean
99.0
/100
|
#105
Exceptional
8.2%
Immigrants | Honduras
99.0
/100
|
#106
Exceptional
8.2%
Sri Lankans
98.9
/100
|
#107
Exceptional
8.2%
Laotians
98.8
/100
|
#108
Exceptional
8.2%
Immigrants | Lebanon
98.8
/100
|
#109
Exceptional
8.2%
Marshallese
98.7
/100
|
#110
Exceptional
8.2%
French American Indians
98.7
/100
|
#111
Exceptional
8.2%

Demographics Similar to Alsatians by Unemployment Among Seniors over 75 years

In terms of unemployment among seniors over 75 years, the demographic groups most similar to Alsatians are Hopi (6.3%, a difference of 2.6%), Cheyenne (5.9%, a difference of 2.9%), Chinese (5.9%, a difference of 3.5%), Crow (5.9%, a difference of 3.5%), and Immigrants from Armenia (6.5%, a difference of 6.5%).
DemographicsRating | RankUnemployment Among Seniors over 75 years
Crow
100.0
/100
|
#1
Exceptional
5.9%
Chinese
100.0
/100
|
#2
Exceptional
5.9%
Cheyenne
100.0
/100
|
#3
Exceptional
5.9%
Alsatians
100.0
/100
|
#4
Exceptional
6.1%
Hopi
100.0
/100
|
#5
Exceptional
6.3%
Immigrants | Armenia
100.0
/100
|
#6
Exceptional
6.5%
Spanish American Indians
100.0
/100
|
#7
Exceptional
6.5%
Taiwanese
100.0
/100
|
#8
Exceptional
6.6%
Soviet Union
100.0
/100
|
#9
Exceptional
6.6%
Yuman
100.0
/100
|
#10
Exceptional
6.7%
Immigrants | Grenada
100.0
/100
|
#11
Exceptional
6.7%
Comanche
100.0
/100
|
#12
Exceptional
6.7%
Immigrants | Congo
100.0
/100
|
#13
Exceptional
6.7%
Ute
100.0
/100
|
#14
Exceptional
6.8%
Icelanders
100.0
/100
|
#15
Exceptional
7.0%