Immigrants from South America vs Immigrants from Ukraine Unemployment Among Seniors over 75 years

COMPARE

Immigrants from South America
Race
Ancestry
AfghanAfricanAlaska NativeAlaskan AthabascanAlbanianAleutAlsatianAmericanApacheArabArapahoArgentineanArmenianAssyrian/Chaldean/SyriacAustralianAustrianBahamianBangladeshiBarbadianBasqueBelgianBelizeanBermudanBhutaneseBlackfeetBolivianBrazilianBritishBritish West IndianBulgarianBurmeseCajunCambodianCanadianCape VerdeanCarpatho RusynCelticCentral AmericanCentral American IndianCherokeeCheyenneChickasawChileanChineseChippewaChoctawColombianColvilleComancheCosta RicanCreeCreekCroatianCrowCubanCypriotCzechCzechoslovakianDanishDelawareDominicanDutchDutch West IndianEastern EuropeanEcuadorianEgyptianEnglishEstonianEthiopianEuropeanFijianFilipinoFinnishFrenchFrench American IndianFrench CanadianGermanGerman RussianGhanaianGreekGuamanian/ChamorroGuatemalanGuyaneseHaitianHmongHonduranHopiHoumaHungarianIcelanderIndian (Asian)IndonesianInupiatIranianIraqiIrishIroquoisIsraeliItalianJamaicanJapaneseJordanianKenyanKiowaKoreanLaotianLatvianLebaneseLiberianLithuanianLumbeeLuxembourgerMacedonianMalaysianMalteseMarshalleseMexicanMexican American IndianMongolianMoroccanNative HawaiianNavajoNepaleseNew ZealanderNicaraguanNigerianNorthern EuropeanNorwegianOkinawanOsageOttawaPaiutePakistaniPalestinianPanamanianParaguayanPennsylvania GermanPeruvianPimaPolishPortuguesePotawatomiPuebloPuerto RicanPuget Sound SalishRomanianRussianSalvadoranSamoanScandinavianScotch-IrishScottishSeminoleSenegaleseSerbianShoshoneSierra LeoneanSiouxSlavicSlovakSloveneSomaliSouth AfricanSouth AmericanSouth American IndianSoviet UnionSpaniardSpanishSpanish AmericanSpanish American IndianSri LankanSubsaharan AfricanSudaneseSwedishSwissSyrianTaiwaneseThaiTlingit-HaidaTohono O'OdhamTonganTrinidadian and TobagonianTsimshianTurkishU.S. Virgin IslanderUgandanUkrainianUruguayanUteVenezuelanVietnameseWelshWest IndianYakamaYaquiYugoslavianYumanYup'ikZimbabwean
Immigration
NonimmigrantsImmigrantsAfghanistanAfricaAlbaniaArgentinaArmeniaAsiaAustraliaAustriaBahamasBangladeshBarbadosBelarusBelgiumBelizeBoliviaBosnia and HerzegovinaBrazilBulgariaBurma/MyanmarCabo VerdeCambodiaCameroonCanadaCaribbeanCentral AmericaChileChinaColombiaCongoCosta RicaCroatiaCubaCzechoslovakiaDenmarkDominicaDominican RepublicEastern AfricaEastern AsiaEastern EuropeEcuadorEgyptEl SalvadorEnglandEritreaEthiopiaEuropeFijiFranceGermanyGhanaGreeceGrenadaGuatemalaGuyanaHaitiHondurasHong KongHungaryIndiaIndonesiaIranIraqIrelandIsraelItalyJamaicaJapanJordanKazakhstanKenyaKoreaKuwaitLaosLatin AmericaLatviaLebanonLiberiaLithuaniaMalaysiaMexicoMicronesiaMiddle AfricaMoldovaMoroccoNepalNetherlandsNicaraguaNigeriaNorth AmericaNorth MacedoniaNorthern AfricaNorthern EuropeNorwayOceaniaPakistanPanamaPeruPhilippinesPolandPortugalRomaniaRussiaSaudi ArabiaScotlandSenegalSerbiaSierra LeoneSingaporeSomaliaSouth AfricaSouth AmericaSouth Central AsiaSouth Eastern AsiaSouthern EuropeSpainSri LankaSt. Vincent and the GrenadinesSudanSwedenSwitzerlandSyriaTaiwanThailandTrinidad and TobagoTurkeyUgandaUruguayUzbekistanVenezuelaVietnamWest IndiesWestern AfricaWestern AsiaWestern EuropeYemenZaireZimbabweAzores
Immigrants from Ukraine
Race
Ancestry
AfghanAfricanAlaska NativeAlaskan AthabascanAlbanianAleutAlsatianAmericanApacheArabArapahoArgentineanArmenianAssyrian/Chaldean/SyriacAustralianAustrianBahamianBangladeshiBarbadianBasqueBelgianBelizeanBermudanBhutaneseBlackfeetBolivianBrazilianBritishBritish West IndianBulgarianBurmeseCajunCambodianCanadianCape VerdeanCarpatho RusynCelticCentral AmericanCentral American IndianCherokeeCheyenneChickasawChileanChineseChippewaChoctawColombianColvilleComancheCosta RicanCreeCreekCroatianCrowCubanCypriotCzechCzechoslovakianDanishDelawareDominicanDutchDutch West IndianEastern EuropeanEcuadorianEgyptianEnglishEstonianEthiopianEuropeanFijianFilipinoFinnishFrenchFrench American IndianFrench CanadianGermanGerman RussianGhanaianGreekGuamanian/ChamorroGuatemalanGuyaneseHaitianHmongHonduranHopiHoumaHungarianIcelanderIndian (Asian)IndonesianInupiatIranianIraqiIrishIroquoisIsraeliItalianJamaicanJapaneseJordanianKenyanKiowaKoreanLaotianLatvianLebaneseLiberianLithuanianLumbeeLuxembourgerMacedonianMalaysianMalteseMarshalleseMexicanMexican American IndianMongolianMoroccanNative HawaiianNavajoNepaleseNew ZealanderNicaraguanNigerianNorthern EuropeanNorwegianOkinawanOsageOttawaPaiutePakistaniPalestinianPanamanianParaguayanPennsylvania GermanPeruvianPimaPolishPortuguesePotawatomiPuebloPuerto RicanPuget Sound SalishRomanianRussianSalvadoranSamoanScandinavianScotch-IrishScottishSeminoleSenegaleseSerbianShoshoneSierra LeoneanSiouxSlavicSlovakSloveneSomaliSouth AfricanSouth AmericanSouth American IndianSoviet UnionSpaniardSpanishSpanish AmericanSpanish American IndianSri LankanSubsaharan AfricanSudaneseSwedishSwissSyrianTaiwaneseThaiTlingit-HaidaTohono O'OdhamTonganTrinidadian and TobagonianTsimshianTurkishU.S. Virgin IslanderUgandanUkrainianUruguayanUteVenezuelanVietnameseWelshWest IndianYakamaYaquiYugoslavianYumanYup'ikZimbabwean
Immigration
NonimmigrantsImmigrantsAfghanistanAfricaAlbaniaArgentinaArmeniaAsiaAustraliaAustriaBahamasBangladeshBarbadosBelarusBelgiumBelizeBoliviaBosnia and HerzegovinaBrazilBulgariaBurma/MyanmarCabo VerdeCambodiaCameroonCanadaCaribbeanCentral AmericaChileChinaColombiaCongoCosta RicaCroatiaCubaCzechoslovakiaDenmarkDominicaDominican RepublicEastern AfricaEastern AsiaEastern EuropeEcuadorEgyptEl SalvadorEnglandEritreaEthiopiaEuropeFijiFranceGermanyGhanaGreeceGrenadaGuatemalaGuyanaHaitiHondurasHong KongHungaryIndiaIndonesiaIranIraqIrelandIsraelItalyJamaicaJapanJordanKazakhstanKenyaKoreaKuwaitLaosLatin AmericaLatviaLebanonLiberiaLithuaniaMalaysiaMexicoMicronesiaMiddle AfricaMoldovaMoroccoNepalNetherlandsNicaraguaNigeriaNorth AmericaNorth MacedoniaNorthern AfricaNorthern EuropeNorwayOceaniaPakistanPanamaPeruPhilippinesPolandPortugalRomaniaRussiaSaudi ArabiaScotlandSenegalSerbiaSierra LeoneSingaporeSomaliaSouth AfricaSouth Central AsiaSouth Eastern AsiaSouthern EuropeSpainSri LankaSt. Vincent and the GrenadinesSudanSwedenSwitzerlandSyriaTaiwanThailandTrinidad and TobagoTurkeyUgandaUkraineUruguayUzbekistanVenezuelaVietnamWest IndiesWestern AfricaWestern AsiaWestern EuropeYemenZaireZimbabweAzores
Unemployment Among Seniors over 75 years
Income
Poverty
Unemployment
Labor Participation
Family Structure
Vehicle Availability
Education Level
Disability

Unemployment Among Seniors over 75 years Comparison

Immigrants from South America

Immigrants from Ukraine

Good
Excellent
8.6%
UNEMPLOYMENT AMONG SENIORS OVER 75 YEARS
71.3/ 100
METRIC RATING
162nd/ 347
METRIC RANK
8.5%
UNEMPLOYMENT AMONG SENIORS OVER 75 YEARS
87.0/ 100
METRIC RATING
142nd/ 347
METRIC RANK

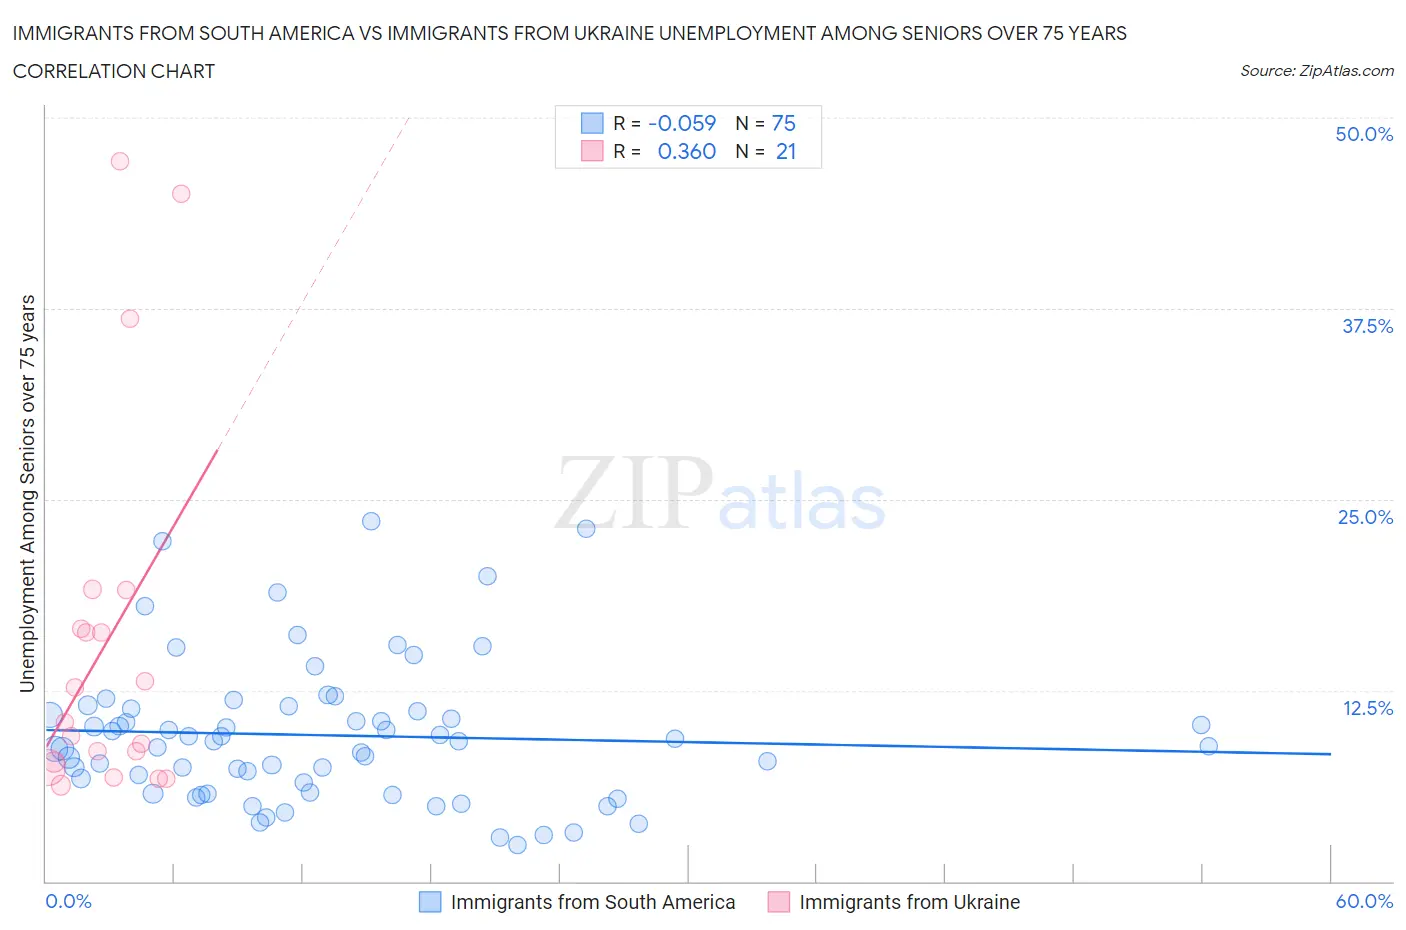
Immigrants from South America vs Immigrants from Ukraine Unemployment Among Seniors over 75 years Correlation Chart

The statistical analysis conducted on geographies consisting of 224,227,019 people shows a slight negative correlation between the proportion of Immigrants from South America and unemployment rate among seniors over the age of 75 in the United States with a correlation coefficient (R) of -0.059 and weighted average of 8.6%. Similarly, the statistical analysis conducted on geographies consisting of 165,762,931 people shows a mild positive correlation between the proportion of Immigrants from Ukraine and unemployment rate among seniors over the age of 75 in the United States with a correlation coefficient (R) of 0.360 and weighted average of 8.5%, a difference of 1.4%.
Immigrants from South America vs Immigrants from Ukraine Unemployment Among Seniors over 75 years

Unemployment Among Seniors over 75 years Correlation Summary

MeasurementImmigrants from South AmericaImmigrants from Ukraine
Minimum2.4%6.3%
Maximum23.6%47.1%
Range21.2%40.8%
Mean9.6%15.7%
Median9.2%10.4%
Interquartile 25% (IQ1)5.8%7.6%
Interquartile 75% (IQ3)11.3%17.8%
Interquartile Range (IQR)5.5%10.2%
Standard Deviation (Sample)4.7%12.3%
Standard Deviation (Population)4.6%12.0%

Demographics Similar to Immigrants from South America and Immigrants from Ukraine by Unemployment Among Seniors over 75 years

In terms of unemployment among seniors over 75 years, the demographic groups most similar to Immigrants from South America are Cree (8.6%, a difference of 0.10%), Albanian (8.6%, a difference of 0.10%), Shoshone (8.6%, a difference of 0.23%), Ethiopian (8.6%, a difference of 0.28%), and Turkish (8.6%, a difference of 0.36%). Similarly, the demographic groups most similar to Immigrants from Ukraine are Immigrants from Costa Rica (8.5%, a difference of 0.030%), Colombian (8.5%, a difference of 0.040%), Immigrants from Romania (8.5%, a difference of 0.090%), Immigrants from South Eastern Asia (8.5%, a difference of 0.14%), and Immigrants from Sierra Leone (8.5%, a difference of 0.17%).
DemographicsRating | RankUnemployment Among Seniors over 75 years
Immigrants | Ukraine
87.0
/100
|
#142
Excellent
8.5%
Immigrants | Costa Rica
86.8
/100
|
#143
Excellent
8.5%
Colombians
86.7
/100
|
#144
Excellent
8.5%
Immigrants | Romania
86.2
/100
|
#145
Excellent
8.5%
Immigrants | South Eastern Asia
85.8
/100
|
#146
Excellent
8.5%
Immigrants | Sierra Leone
85.6
/100
|
#147
Excellent
8.5%
Immigrants | Colombia
85.6
/100
|
#148
Excellent
8.5%
Immigrants | Ecuador
84.6
/100
|
#149
Excellent
8.5%
Paiute
82.5
/100
|
#150
Excellent
8.6%
Immigrants | Bosnia and Herzegovina
80.6
/100
|
#151
Excellent
8.6%
Latvians
80.5
/100
|
#152
Excellent
8.6%
Mongolians
80.1
/100
|
#153
Excellent
8.6%
Immigrants | Pakistan
79.7
/100
|
#154
Good
8.6%
Ecuadorians
78.5
/100
|
#155
Good
8.6%
Immigrants | Bahamas
76.5
/100
|
#156
Good
8.6%
Turks
76.4
/100
|
#157
Good
8.6%
Ethiopians
75.3
/100
|
#158
Good
8.6%
Shoshone
74.6
/100
|
#159
Good
8.6%
Cree
72.8
/100
|
#160
Good
8.6%
Albanians
72.8
/100
|
#161
Good
8.6%
Immigrants | South America
71.3
/100
|
#162
Good
8.6%