Immigrants from South America vs Immigrants from Nepal Unemployment Among Women with Children Under 18 years
COMPARE
Immigrants from South America
Immigrants from Nepal
Unemployment Among Women with Children Under 18 years
Unemployment Among Women with Children Under 18 years Comparison
Immigrants from South America
Immigrants from Nepal
5.8%
UNEMPLOYMENT AMONG WOMEN WITH CHILDREN UNDER 18 YEARS
3.2/ 100
METRIC RATING
230th/ 347
METRIC RANK
5.1%
UNEMPLOYMENT AMONG WOMEN WITH CHILDREN UNDER 18 YEARS
98.3/ 100
METRIC RATING
52nd/ 347
METRIC RANK
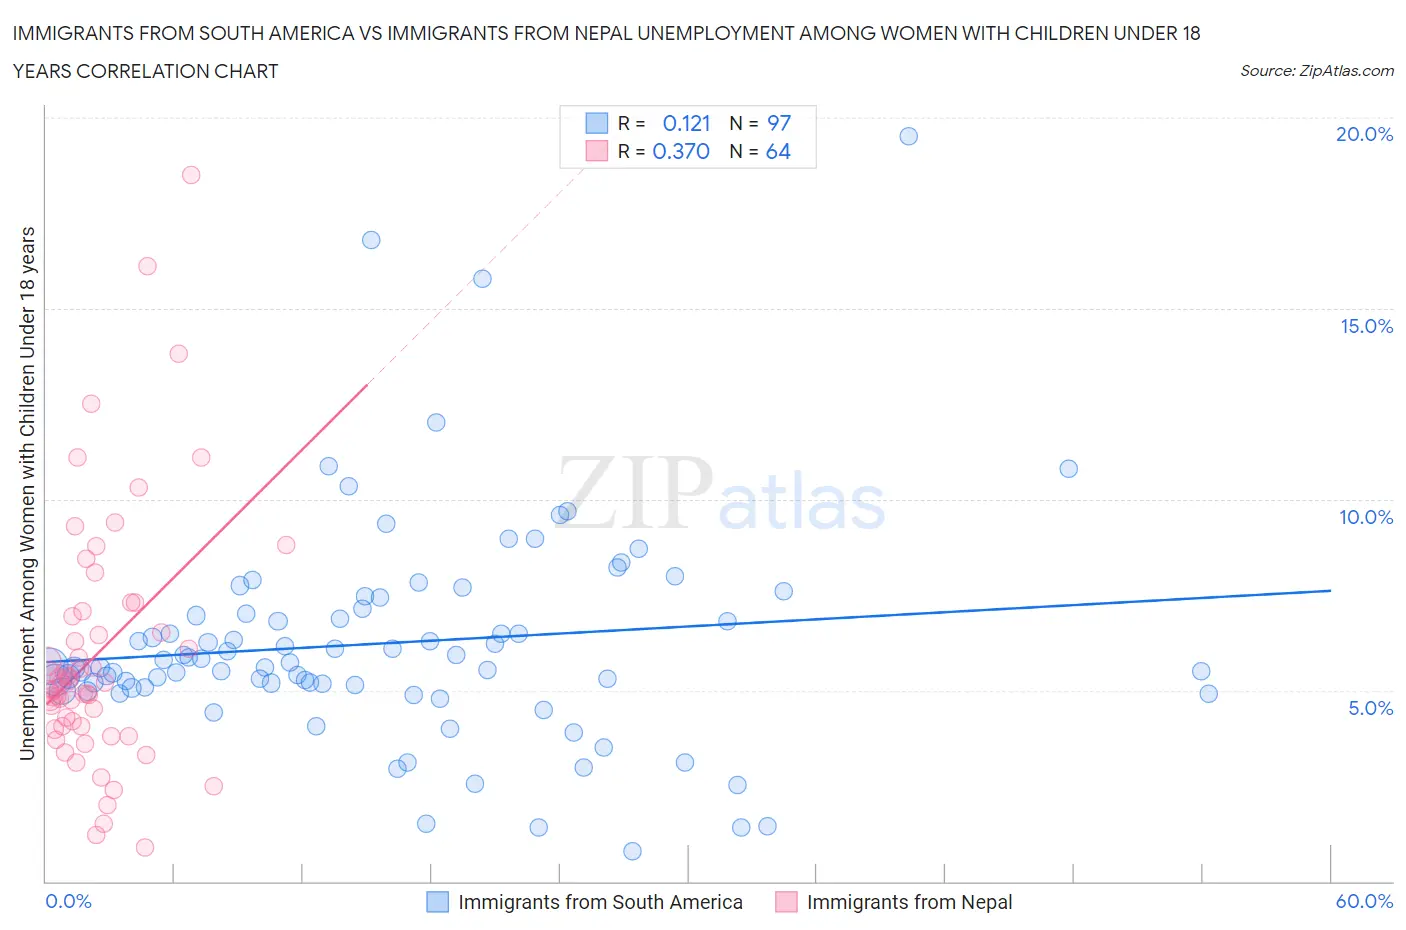
Immigrants from South America vs Immigrants from Nepal Unemployment Among Women with Children Under 18 years Correlation Chart
The statistical analysis conducted on geographies consisting of 459,966,443 people shows a poor positive correlation between the proportion of Immigrants from South America and unemployment rate among women with children under the age of 18 in the United States with a correlation coefficient (R) of 0.121 and weighted average of 5.8%. Similarly, the statistical analysis conducted on geographies consisting of 183,235,673 people shows a mild positive correlation between the proportion of Immigrants from Nepal and unemployment rate among women with children under the age of 18 in the United States with a correlation coefficient (R) of 0.370 and weighted average of 5.1%, a difference of 14.2%.
Unemployment Among Women with Children Under 18 years Correlation Summary
| Measurement | Immigrants from South America | Immigrants from Nepal |
| Minimum | 0.80% | 0.90% |
| Maximum | 19.5% | 18.5% |
| Range | 18.7% | 17.6% |
| Mean | 6.2% | 6.0% |
| Median | 5.6% | 5.2% |
| Interquartile 25% (IQ1) | 5.1% | 4.1% |
| Interquartile 75% (IQ3) | 7.1% | 7.0% |
| Interquartile Range (IQR) | 2.0% | 2.9% |
| Standard Deviation (Sample) | 2.9% | 3.3% |
| Standard Deviation (Population) | 2.9% | 3.3% |
Similar Demographics by Unemployment Among Women with Children Under 18 years
Demographics Similar to Immigrants from South America by Unemployment Among Women with Children Under 18 years
In terms of unemployment among women with children under 18 years, the demographic groups most similar to Immigrants from South America are Immigrants from Panama (5.8%, a difference of 0.060%), Immigrants from Africa (5.8%, a difference of 0.060%), Creek (5.8%, a difference of 0.090%), Spanish American (5.8%, a difference of 0.11%), and Somali (5.8%, a difference of 0.15%).
| Demographics | Rating | Rank | Unemployment Among Women with Children Under 18 years |
| Potawatomi | 5.0 /100 | #223 | Tragic 5.7% |
| Immigrants | Syria | 4.6 /100 | #224 | Tragic 5.7% |
| Armenians | 4.5 /100 | #225 | Tragic 5.7% |
| Cherokee | 4.3 /100 | #226 | Tragic 5.7% |
| Sierra Leoneans | 3.8 /100 | #227 | Tragic 5.8% |
| Somalis | 3.5 /100 | #228 | Tragic 5.8% |
| Immigrants | Panama | 3.4 /100 | #229 | Tragic 5.8% |
| Immigrants | South America | 3.2 /100 | #230 | Tragic 5.8% |
| Immigrants | Africa | 3.1 /100 | #231 | Tragic 5.8% |
| Creek | 3.1 /100 | #232 | Tragic 5.8% |
| Spanish Americans | 3.1 /100 | #233 | Tragic 5.8% |
| Guamanians/Chamorros | 2.9 /100 | #234 | Tragic 5.8% |
| Immigrants | Middle Africa | 2.8 /100 | #235 | Tragic 5.8% |
| Alsatians | 2.5 /100 | #236 | Tragic 5.8% |
| Immigrants | Lebanon | 2.4 /100 | #237 | Tragic 5.8% |
Demographics Similar to Immigrants from Nepal by Unemployment Among Women with Children Under 18 years
In terms of unemployment among women with children under 18 years, the demographic groups most similar to Immigrants from Nepal are Yugoslavian (5.1%, a difference of 0.0%), Immigrants from Japan (5.0%, a difference of 0.080%), Scottish (5.1%, a difference of 0.090%), Lithuanian (5.0%, a difference of 0.11%), and Immigrants from Serbia (5.1%, a difference of 0.12%).
| Demographics | Rating | Rank | Unemployment Among Women with Children Under 18 years |
| Immigrants | Malaysia | 98.8 /100 | #45 | Exceptional 5.0% |
| Immigrants | Korea | 98.7 /100 | #46 | Exceptional 5.0% |
| British | 98.7 /100 | #47 | Exceptional 5.0% |
| Northern Europeans | 98.6 /100 | #48 | Exceptional 5.0% |
| Lithuanians | 98.4 /100 | #49 | Exceptional 5.0% |
| Immigrants | Japan | 98.4 /100 | #50 | Exceptional 5.0% |
| Yugoslavians | 98.3 /100 | #51 | Exceptional 5.1% |
| Immigrants | Nepal | 98.3 /100 | #52 | Exceptional 5.1% |
| Scottish | 98.2 /100 | #53 | Exceptional 5.1% |
| Immigrants | Serbia | 98.2 /100 | #54 | Exceptional 5.1% |
| Immigrants | Sri Lanka | 98.1 /100 | #55 | Exceptional 5.1% |
| Immigrants | Ireland | 98.0 /100 | #56 | Exceptional 5.1% |
| Czechoslovakians | 98.0 /100 | #57 | Exceptional 5.1% |
| Immigrants | Belgium | 97.9 /100 | #58 | Exceptional 5.1% |
| Asians | 97.9 /100 | #59 | Exceptional 5.1% |