Immigrants from South Africa vs Central American Unemployment Among Ages 20 to 24 years

COMPARE

Immigrants from South Africa
Race
Ancestry
AfghanAfricanAlaska NativeAlaskan AthabascanAlbanianAleutAlsatianAmericanApacheArabArapahoArgentineanArmenianAssyrian/Chaldean/SyriacAustralianAustrianBahamianBangladeshiBarbadianBasqueBelgianBelizeanBermudanBhutaneseBlackfeetBolivianBrazilianBritishBritish West IndianBulgarianBurmeseCajunCambodianCanadianCape VerdeanCarpatho RusynCelticCentral American IndianCherokeeCheyenneChickasawChileanChineseChippewaChoctawColombianColvilleComancheCosta RicanCreeCreekCroatianCrowCubanCypriotCzechCzechoslovakianDanishDelawareDominicanDutchDutch West IndianEastern EuropeanEcuadorianEgyptianEnglishEstonianEthiopianEuropeanFijianFilipinoFinnishFrenchFrench American IndianFrench CanadianGermanGerman RussianGhanaianGreekGuamanian/ChamorroGuatemalanGuyaneseHaitianHmongHonduranHopiHoumaHungarianIcelanderIndian (Asian)IndonesianInupiatIranianIraqiIrishIroquoisIsraeliItalianJamaicanJapaneseJordanianKenyanKiowaKoreanLaotianLatvianLebaneseLiberianLithuanianLumbeeLuxembourgerMacedonianMalaysianMalteseMarshalleseMenomineeMexicanMexican American IndianMongolianMoroccanNative HawaiianNavajoNepaleseNew ZealanderNicaraguanNigerianNorthern EuropeanNorwegianOkinawanOsageOttawaPaiutePakistaniPalestinianPanamanianParaguayanPennsylvania GermanPeruvianPimaPolishPortuguesePotawatomiPuebloPuerto RicanPuget Sound SalishRomanianRussianSalvadoranSamoanScandinavianScotch-IrishScottishSeminoleSenegaleseSerbianShoshoneSierra LeoneanSiouxSlavicSlovakSloveneSomaliSouth AfricanSouth AmericanSouth American IndianSoviet UnionSpaniardSpanishSpanish AmericanSpanish American IndianSri LankanSubsaharan AfricanSudaneseSwedishSwissSyrianTaiwaneseThaiTlingit-HaidaTohono O'OdhamTonganTrinidadian and TobagonianTsimshianTurkishU.S. Virgin IslanderUgandanUkrainianUruguayanUteVenezuelanVietnameseWelshWest IndianYakamaYaquiYugoslavianYumanYup'ikZimbabwean
Immigration
NonimmigrantsImmigrantsAfghanistanAfricaAlbaniaArgentinaArmeniaAsiaAustraliaAustriaBahamasBangladeshBarbadosBelarusBelgiumBelizeBoliviaBosnia and HerzegovinaBrazilBulgariaBurma/MyanmarCabo VerdeCambodiaCameroonCanadaCaribbeanCentral AmericaChileChinaColombiaCongoCosta RicaCroatiaCubaCzechoslovakiaDenmarkDominicaDominican RepublicEastern AfricaEastern AsiaEastern EuropeEcuadorEgyptEl SalvadorEnglandEritreaEthiopiaEuropeFijiFranceGermanyGhanaGreeceGrenadaGuatemalaGuyanaHaitiHondurasHong KongHungaryIndiaIndonesiaIranIraqIrelandIsraelItalyJamaicaJapanJordanKazakhstanKenyaKoreaKuwaitLaosLatin AmericaLatviaLebanonLiberiaLithuaniaMalaysiaMexicoMicronesiaMiddle AfricaMoldovaMoroccoNepalNetherlandsNicaraguaNigeriaNorth AmericaNorth MacedoniaNorthern AfricaNorthern EuropeNorwayOceaniaPakistanPanamaPeruPhilippinesPolandPortugalRomaniaRussiaSaudi ArabiaScotlandSenegalSerbiaSierra LeoneSingaporeSomaliaSouth AfricaSouth AmericaSouth Central AsiaSouth Eastern AsiaSouthern EuropeSpainSri LankaSt. Vincent and the GrenadinesSudanSwedenSwitzerlandSyriaTaiwanThailandTrinidad and TobagoTurkeyUgandaUkraineUruguayUzbekistanVenezuelaVietnamWest IndiesWestern AfricaWestern AsiaWestern EuropeYemenZaireZimbabweAzores
Central American
Race
Ancestry
AfghanAfricanAlaska NativeAlaskan AthabascanAlbanianAleutAlsatianAmericanApacheArabArapahoArgentineanArmenianAssyrian/Chaldean/SyriacAustralianAustrianBahamianBangladeshiBarbadianBasqueBelgianBelizeanBermudanBhutaneseBlackfeetBolivianBrazilianBritishBritish West IndianBulgarianBurmeseCajunCambodianCanadianCape VerdeanCarpatho RusynCelticCentral AmericanCentral American IndianCherokeeCheyenneChickasawChileanChineseChippewaChoctawColombianColvilleComancheCosta RicanCreeCreekCroatianCrowCubanCypriotCzechCzechoslovakianDanishDelawareDominicanDutchDutch West IndianEastern EuropeanEcuadorianEgyptianEnglishEstonianEthiopianEuropeanFijianFilipinoFinnishFrenchFrench American IndianFrench CanadianGermanGerman RussianGhanaianGreekGuamanian/ChamorroGuatemalanGuyaneseHaitianHmongHonduranHopiHoumaHungarianIcelanderIndian (Asian)IndonesianInupiatIranianIraqiIrishIroquoisIsraeliItalianJamaicanJapaneseJordanianKenyanKiowaKoreanLaotianLatvianLebaneseLiberianLithuanianLumbeeLuxembourgerMacedonianMalaysianMalteseMarshalleseMenomineeMexicanMexican American IndianMongolianMoroccanNative HawaiianNavajoNepaleseNew ZealanderNicaraguanNigerianNorthern EuropeanNorwegianOkinawanOsageOttawaPaiutePakistaniPalestinianPanamanianParaguayanPennsylvania GermanPeruvianPimaPolishPortuguesePotawatomiPuebloPuerto RicanPuget Sound SalishRomanianRussianSalvadoranSamoanScandinavianScotch-IrishScottishSeminoleSenegaleseSerbianShoshoneSierra LeoneanSiouxSlavicSlovakSloveneSomaliSouth AfricanSouth AmericanSouth American IndianSoviet UnionSpaniardSpanishSpanish AmericanSpanish American IndianSri LankanSubsaharan AfricanSudaneseSwedishSwissSyrianTaiwaneseThaiTlingit-HaidaTohono O'OdhamTonganTrinidadian and TobagonianTsimshianTurkishU.S. Virgin IslanderUgandanUkrainianUruguayanUteVenezuelanVietnameseWelshWest IndianYakamaYaquiYugoslavianYumanYup'ikZimbabwean
Immigration
NonimmigrantsImmigrantsAfghanistanAfricaAlbaniaArgentinaArmeniaAsiaAustraliaAustriaBahamasBangladeshBarbadosBelarusBelgiumBelizeBoliviaBosnia and HerzegovinaBrazilBulgariaBurma/MyanmarCabo VerdeCambodiaCameroonCanadaCaribbeanCentral AmericaChileChinaColombiaCongoCosta RicaCroatiaCubaCzechoslovakiaDenmarkDominicaDominican RepublicEastern AfricaEastern AsiaEastern EuropeEcuadorEgyptEl SalvadorEnglandEritreaEthiopiaEuropeFijiFranceGermanyGhanaGreeceGrenadaGuatemalaGuyanaHaitiHondurasHong KongHungaryIndiaIndonesiaIranIraqIrelandIsraelItalyJamaicaJapanJordanKazakhstanKenyaKoreaKuwaitLaosLatin AmericaLatviaLebanonLiberiaLithuaniaMalaysiaMexicoMicronesiaMiddle AfricaMoldovaMoroccoNepalNetherlandsNicaraguaNigeriaNorth AmericaNorth MacedoniaNorthern AfricaNorthern EuropeNorwayOceaniaPakistanPanamaPeruPhilippinesPolandPortugalRomaniaRussiaSaudi ArabiaScotlandSenegalSerbiaSierra LeoneSingaporeSomaliaSouth AmericaSouth Central AsiaSouth Eastern AsiaSouthern EuropeSpainSri LankaSt. Vincent and the GrenadinesSudanSwedenSwitzerlandSyriaTaiwanThailandTrinidad and TobagoTurkeyUgandaUkraineUruguayUzbekistanVenezuelaVietnamWest IndiesWestern AfricaWestern AsiaWestern EuropeYemenZaireZimbabweAzores
Unemployment Among Ages 20 to 24 years
Income
Poverty
Unemployment
Labor Participation
Family Structure
Vehicle Availability
Education Level
Disability

Unemployment Among Ages 20 to 24 years Comparison

Immigrants from South Africa

Central Americans

Good
Tragic
10.2%
UNEMPLOYMENT AMONG AGES 20 TO 24 YEARS
73.6/ 100
METRIC RATING
151st/ 347
METRIC RANK
10.6%
UNEMPLOYMENT AMONG AGES 20 TO 24 YEARS
6.8/ 100
METRIC RATING
221st/ 347
METRIC RANK

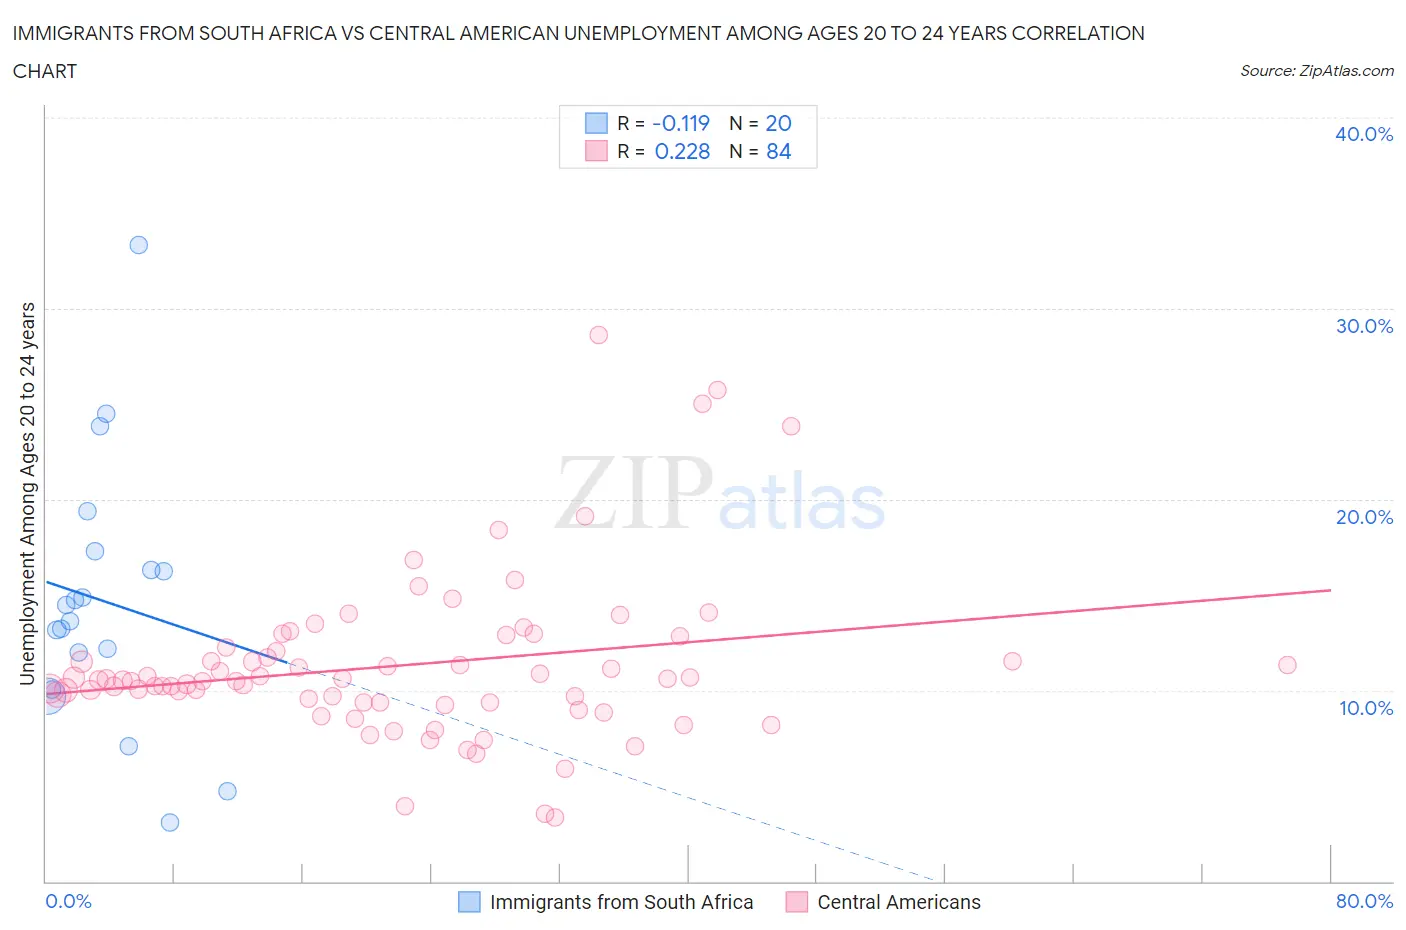
Immigrants from South Africa vs Central American Unemployment Among Ages 20 to 24 years Correlation Chart

The statistical analysis conducted on geographies consisting of 228,793,193 people shows a poor negative correlation between the proportion of Immigrants from South Africa and unemployment rate among population between the ages 20 and 24 in the United States with a correlation coefficient (R) of -0.119 and weighted average of 10.2%. Similarly, the statistical analysis conducted on geographies consisting of 480,623,393 people shows a weak positive correlation between the proportion of Central Americans and unemployment rate among population between the ages 20 and 24 in the United States with a correlation coefficient (R) of 0.228 and weighted average of 10.6%, a difference of 3.4%.
Immigrants from South Africa vs Central American Unemployment Among Ages 20 to 24 years

Unemployment Among Ages 20 to 24 years Correlation Summary

MeasurementImmigrants from South AfricaCentral American
Minimum3.1%3.3%
Maximum33.3%28.6%
Range30.2%25.3%
Mean14.7%11.3%
Median14.0%10.5%
Interquartile 25% (IQ1)11.0%9.4%
Interquartile 75% (IQ3)16.8%12.1%
Interquartile Range (IQR)5.8%2.8%
Standard Deviation (Sample)7.0%4.3%
Standard Deviation (Population)6.8%4.2%

Similar Demographics by Unemployment Among Ages 20 to 24 years

Demographics Similar to Immigrants from South Africa by Unemployment Among Ages 20 to 24 years

In terms of unemployment among ages 20 to 24 years, the demographic groups most similar to Immigrants from South Africa are Hungarian (10.2%, a difference of 0.040%), Immigrants from Scotland (10.2%, a difference of 0.050%), Iranian (10.2%, a difference of 0.060%), Immigrants from Romania (10.2%, a difference of 0.10%), and Immigrants from Taiwan (10.2%, a difference of 0.10%).
DemographicsRating | RankUnemployment Among Ages 20 to 24 years
Brazilians
78.4
/100
|
#144
Good
10.2%
Argentineans
78.0
/100
|
#145
Good
10.2%
Asians
77.7
/100
|
#146
Good
10.2%
French Canadians
77.5
/100
|
#147
Good
10.2%
Immigrants | Romania
75.7
/100
|
#148
Good
10.2%
Immigrants | Scotland
74.6
/100
|
#149
Good
10.2%
Hungarians
74.4
/100
|
#150
Good
10.2%
Immigrants | South Africa
73.6
/100
|
#151
Good
10.2%
Iranians
72.4
/100
|
#152
Good
10.2%
Immigrants | Taiwan
71.4
/100
|
#153
Good
10.2%
Immigrants | Switzerland
71.3
/100
|
#154
Good
10.2%
Lithuanians
70.0
/100
|
#155
Good
10.2%
Canadians
66.7
/100
|
#156
Good
10.2%
Immigrants | Uganda
65.6
/100
|
#157
Good
10.2%
Immigrants | Kazakhstan
65.5
/100
|
#158
Good
10.2%

Demographics Similar to Central Americans by Unemployment Among Ages 20 to 24 years

In terms of unemployment among ages 20 to 24 years, the demographic groups most similar to Central Americans are Eastern European (10.6%, a difference of 0.010%), Immigrants from Poland (10.6%, a difference of 0.060%), Immigrants from Southern Europe (10.5%, a difference of 0.15%), Arab (10.6%, a difference of 0.18%), and Nonimmigrants (10.5%, a difference of 0.25%).
DemographicsRating | RankUnemployment Among Ages 20 to 24 years
Kiowa
11.7
/100
|
#214
Poor
10.5%
Hondurans
10.5
/100
|
#215
Poor
10.5%
Costa Ricans
9.6
/100
|
#216
Tragic
10.5%
Cherokee
9.3
/100
|
#217
Tragic
10.5%
Immigrants | Nonimmigrants
8.8
/100
|
#218
Tragic
10.5%
Immigrants | Southern Europe
8.0
/100
|
#219
Tragic
10.5%
Eastern Europeans
6.9
/100
|
#220
Tragic
10.6%
Central Americans
6.8
/100
|
#221
Tragic
10.6%
Immigrants | Poland
6.4
/100
|
#222
Tragic
10.6%
Arabs
5.6
/100
|
#223
Tragic
10.6%
Nepalese
5.1
/100
|
#224
Tragic
10.6%
Immigrants | South America
5.1
/100
|
#225
Tragic
10.6%
Immigrants | Costa Rica
4.9
/100
|
#226
Tragic
10.6%
Palestinians
4.9
/100
|
#227
Tragic
10.6%
Mexican American Indians
4.6
/100
|
#228
Tragic
10.6%