Immigrants from Somalia vs Immigrants from Kazakhstan Unemployment Among Women with Children Under 6 years
COMPARE
Immigrants from Somalia
Immigrants from Kazakhstan
Unemployment Among Women with Children Under 6 years
Unemployment Among Women with Children Under 6 years Comparison
Immigrants from Somalia
Immigrants from Kazakhstan
7.1%
UNEMPLOYMENT AMONG WOMEN WITH CHILDREN UNDER 6 YEARS
98.9/ 100
METRIC RATING
78th/ 347
METRIC RANK
7.2%
UNEMPLOYMENT AMONG WOMEN WITH CHILDREN UNDER 6 YEARS
97.1/ 100
METRIC RATING
107th/ 347
METRIC RANK
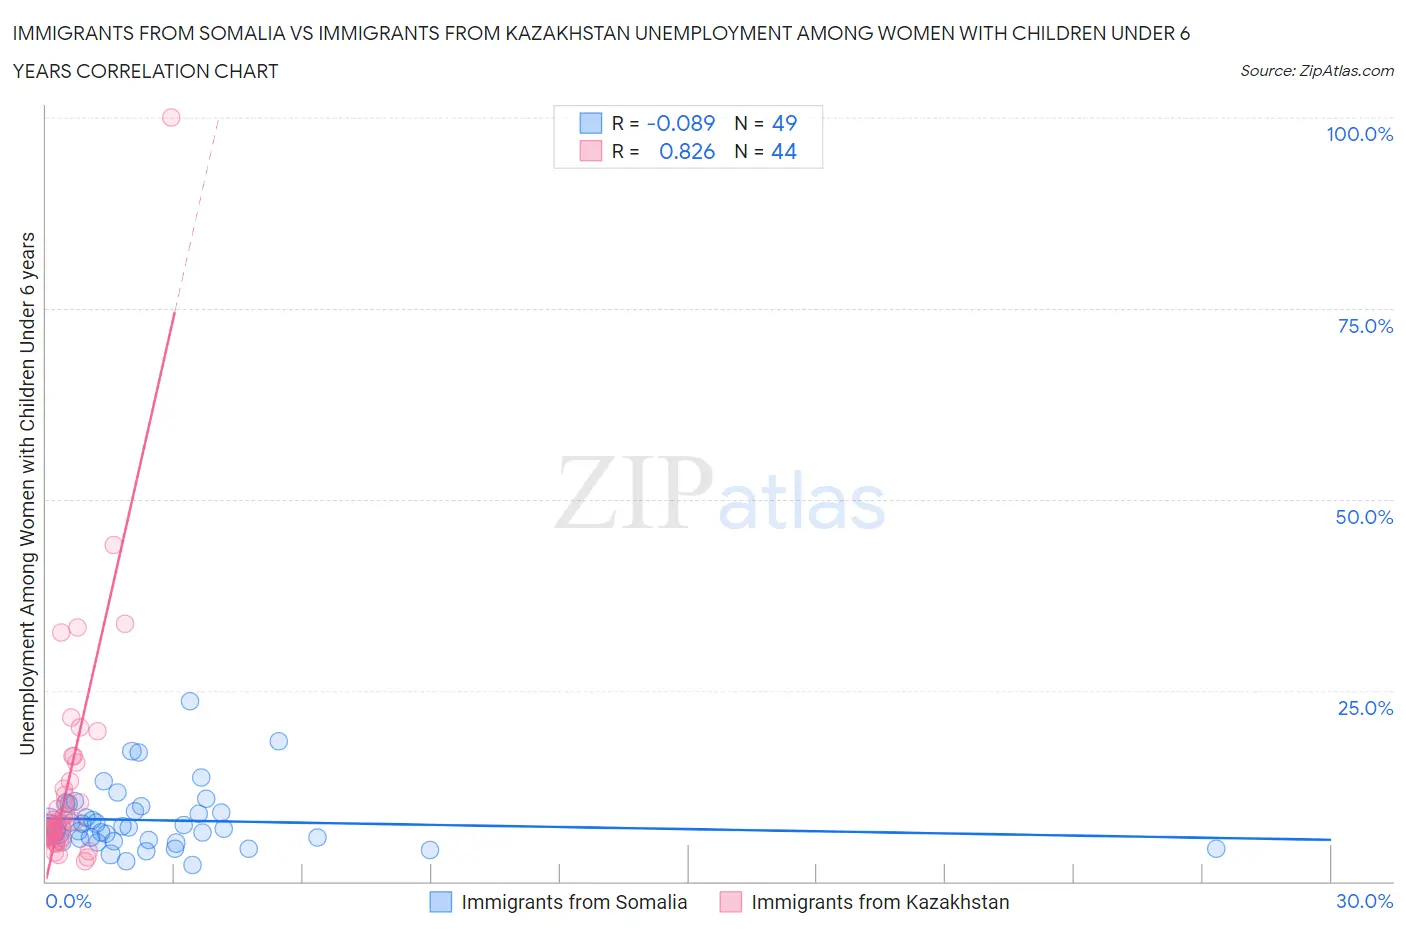
Immigrants from Somalia vs Immigrants from Kazakhstan Unemployment Among Women with Children Under 6 years Correlation Chart
The statistical analysis conducted on geographies consisting of 84,437,163 people shows a slight negative correlation between the proportion of Immigrants from Somalia and unemployment rate among women with children under the age of 6 in the United States with a correlation coefficient (R) of -0.089 and weighted average of 7.1%. Similarly, the statistical analysis conducted on geographies consisting of 109,712,077 people shows a very strong positive correlation between the proportion of Immigrants from Kazakhstan and unemployment rate among women with children under the age of 6 in the United States with a correlation coefficient (R) of 0.826 and weighted average of 7.2%, a difference of 1.8%.
Unemployment Among Women with Children Under 6 years Correlation Summary
| Measurement | Immigrants from Somalia | Immigrants from Kazakhstan |
| Minimum | 2.1% | 2.6% |
| Maximum | 23.5% | 100.0% |
| Range | 21.4% | 97.4% |
| Mean | 8.0% | 13.3% |
| Median | 7.1% | 7.7% |
| Interquartile 25% (IQ1) | 5.3% | 6.0% |
| Interquartile 75% (IQ3) | 9.5% | 14.3% |
| Interquartile Range (IQR) | 4.2% | 8.3% |
| Standard Deviation (Sample) | 4.2% | 16.2% |
| Standard Deviation (Population) | 4.2% | 16.1% |
Similar Demographics by Unemployment Among Women with Children Under 6 years
Demographics Similar to Immigrants from Somalia by Unemployment Among Women with Children Under 6 years
In terms of unemployment among women with children under 6 years, the demographic groups most similar to Immigrants from Somalia are Immigrants from Croatia (7.1%, a difference of 0.040%), Immigrants from Fiji (7.1%, a difference of 0.050%), Estonian (7.1%, a difference of 0.070%), Immigrants from Greece (7.1%, a difference of 0.070%), and Immigrants from Venezuela (7.1%, a difference of 0.11%).
| Demographics | Rating | Rank | Unemployment Among Women with Children Under 6 years |
| Afghans | 99.4 /100 | #71 | Exceptional 7.0% |
| Cubans | 99.4 /100 | #72 | Exceptional 7.0% |
| Immigrants | Czechoslovakia | 99.2 /100 | #73 | Exceptional 7.0% |
| Turks | 99.2 /100 | #74 | Exceptional 7.0% |
| Immigrants | Eastern Europe | 99.0 /100 | #75 | Exceptional 7.1% |
| Estonians | 99.0 /100 | #76 | Exceptional 7.1% |
| Immigrants | Croatia | 98.9 /100 | #77 | Exceptional 7.1% |
| Immigrants | Somalia | 98.9 /100 | #78 | Exceptional 7.1% |
| Immigrants | Fiji | 98.9 /100 | #79 | Exceptional 7.1% |
| Immigrants | Greece | 98.9 /100 | #80 | Exceptional 7.1% |
| Immigrants | Venezuela | 98.8 /100 | #81 | Exceptional 7.1% |
| Immigrants | Afghanistan | 98.7 /100 | #82 | Exceptional 7.1% |
| Egyptians | 98.7 /100 | #83 | Exceptional 7.1% |
| Immigrants | Albania | 98.7 /100 | #84 | Exceptional 7.1% |
| Immigrants | Romania | 98.7 /100 | #85 | Exceptional 7.1% |
Demographics Similar to Immigrants from Kazakhstan by Unemployment Among Women with Children Under 6 years
In terms of unemployment among women with children under 6 years, the demographic groups most similar to Immigrants from Kazakhstan are Immigrants from Pakistan (7.2%, a difference of 0.020%), Venezuelan (7.2%, a difference of 0.030%), Immigrants from Egypt (7.2%, a difference of 0.040%), Immigrants from Nicaragua (7.2%, a difference of 0.12%), and Immigrants from Saudi Arabia (7.2%, a difference of 0.12%).
| Demographics | Rating | Rank | Unemployment Among Women with Children Under 6 years |
| Immigrants | Northern Europe | 97.4 /100 | #100 | Exceptional 7.2% |
| Chileans | 97.4 /100 | #101 | Exceptional 7.2% |
| Immigrants | Nicaragua | 97.3 /100 | #102 | Exceptional 7.2% |
| Immigrants | Saudi Arabia | 97.3 /100 | #103 | Exceptional 7.2% |
| Immigrants | Egypt | 97.2 /100 | #104 | Exceptional 7.2% |
| Venezuelans | 97.2 /100 | #105 | Exceptional 7.2% |
| Immigrants | Pakistan | 97.2 /100 | #106 | Exceptional 7.2% |
| Immigrants | Kazakhstan | 97.1 /100 | #107 | Exceptional 7.2% |
| Eastern Europeans | 96.9 /100 | #108 | Exceptional 7.2% |
| Australians | 96.9 /100 | #109 | Exceptional 7.2% |
| Palestinians | 96.8 /100 | #110 | Exceptional 7.2% |
| Norwegians | 96.7 /100 | #111 | Exceptional 7.2% |
| Israelis | 96.5 /100 | #112 | Exceptional 7.2% |
| Nicaraguans | 96.3 /100 | #113 | Exceptional 7.2% |
| Argentineans | 96.2 /100 | #114 | Exceptional 7.2% |