Immigrants from Sierra Leone vs Immigrants from Southern Europe Unemployment Among Ages 65 to 74 years
COMPARE
Immigrants from Sierra Leone
Immigrants from Southern Europe
Unemployment Among Ages 65 to 74 years
Unemployment Among Ages 65 to 74 years Comparison
Immigrants from Sierra Leone
Immigrants from Southern Europe
5.7%
UNEMPLOYMENT AMONG AGES 65 TO 74 YEARS
0.1/ 100
METRIC RATING
285th/ 347
METRIC RANK
5.6%
UNEMPLOYMENT AMONG AGES 65 TO 74 YEARS
0.3/ 100
METRIC RATING
257th/ 347
METRIC RANK
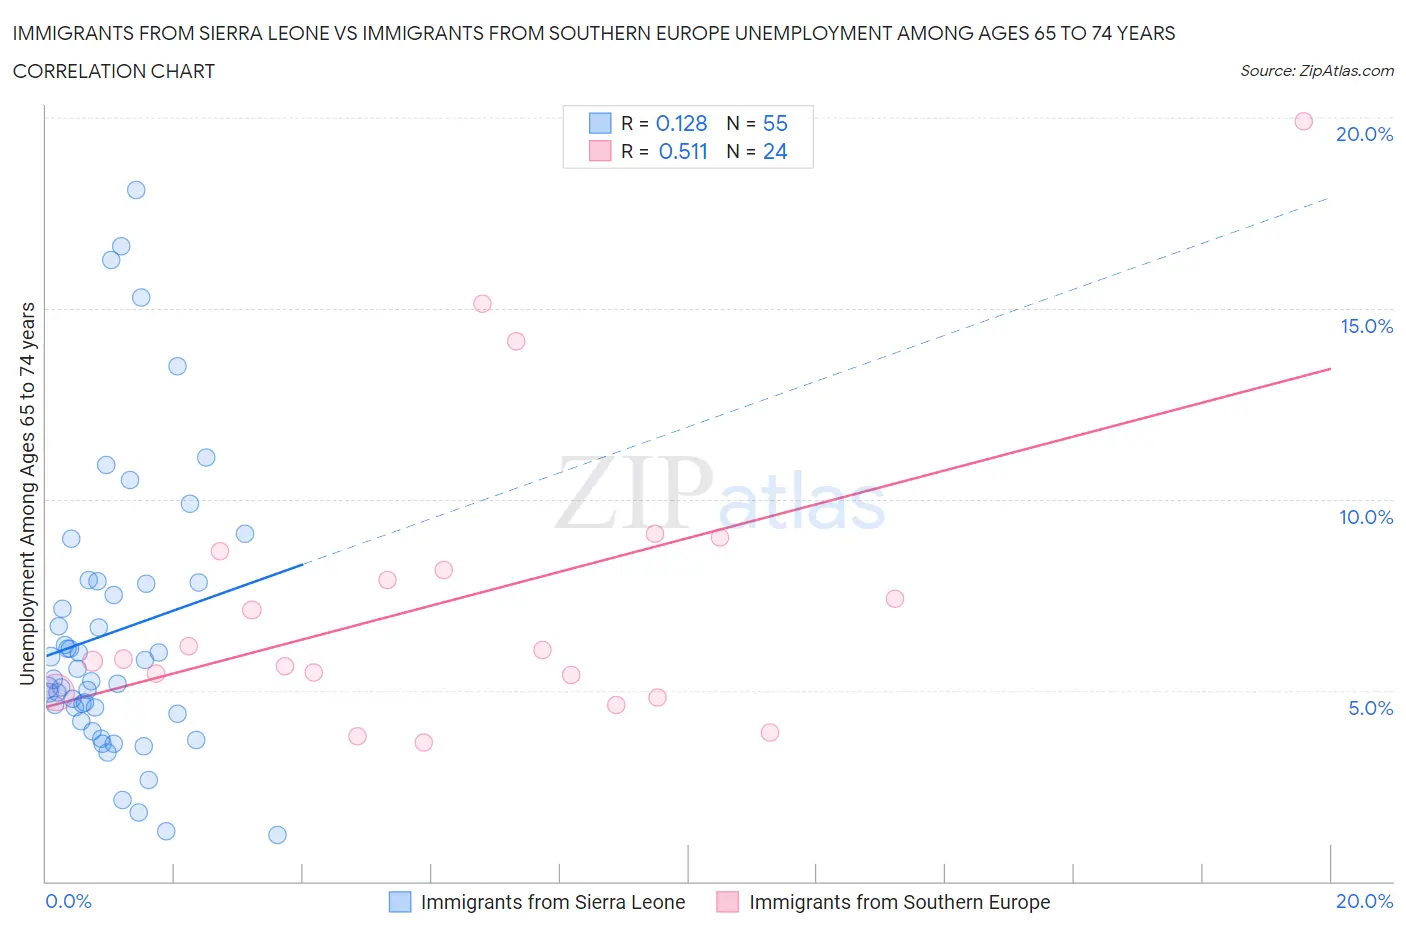
Immigrants from Sierra Leone vs Immigrants from Southern Europe Unemployment Among Ages 65 to 74 years Correlation Chart
The statistical analysis conducted on geographies consisting of 97,887,994 people shows a poor positive correlation between the proportion of Immigrants from Sierra Leone and unemployment rate among population between the ages 65 and 74 in the United States with a correlation coefficient (R) of 0.128 and weighted average of 5.7%. Similarly, the statistical analysis conducted on geographies consisting of 356,658,922 people shows a substantial positive correlation between the proportion of Immigrants from Southern Europe and unemployment rate among population between the ages 65 and 74 in the United States with a correlation coefficient (R) of 0.511 and weighted average of 5.6%, a difference of 1.4%.
Unemployment Among Ages 65 to 74 years Correlation Summary
| Measurement | Immigrants from Sierra Leone | Immigrants from Southern Europe |
| Minimum | 1.2% | 3.6% |
| Maximum | 18.1% | 19.9% |
| Range | 16.9% | 16.3% |
| Mean | 6.5% | 7.4% |
| Median | 5.3% | 5.9% |
| Interquartile 25% (IQ1) | 4.4% | 5.2% |
| Interquartile 75% (IQ3) | 7.8% | 8.4% |
| Interquartile Range (IQR) | 3.4% | 3.2% |
| Standard Deviation (Sample) | 3.8% | 3.9% |
| Standard Deviation (Population) | 3.7% | 3.8% |
Similar Demographics by Unemployment Among Ages 65 to 74 years
Demographics Similar to Immigrants from Sierra Leone by Unemployment Among Ages 65 to 74 years
In terms of unemployment among ages 65 to 74 years, the demographic groups most similar to Immigrants from Sierra Leone are Marshallese (5.7%, a difference of 0.030%), Chippewa (5.7%, a difference of 0.050%), Cypriot (5.7%, a difference of 0.060%), Ottawa (5.7%, a difference of 0.10%), and Central American Indian (5.7%, a difference of 0.11%).
| Demographics | Rating | Rank | Unemployment Among Ages 65 to 74 years |
| Mexican American Indians | 0.1 /100 | #278 | Tragic 5.7% |
| Immigrants | Norway | 0.1 /100 | #279 | Tragic 5.7% |
| Moroccans | 0.1 /100 | #280 | Tragic 5.7% |
| Immigrants | West Indies | 0.1 /100 | #281 | Tragic 5.7% |
| Ottawa | 0.1 /100 | #282 | Tragic 5.7% |
| Cypriots | 0.1 /100 | #283 | Tragic 5.7% |
| Chippewa | 0.1 /100 | #284 | Tragic 5.7% |
| Immigrants | Sierra Leone | 0.1 /100 | #285 | Tragic 5.7% |
| Marshallese | 0.1 /100 | #286 | Tragic 5.7% |
| Central American Indians | 0.0 /100 | #287 | Tragic 5.7% |
| Central Americans | 0.0 /100 | #288 | Tragic 5.7% |
| Immigrants | Somalia | 0.0 /100 | #289 | Tragic 5.7% |
| Spanish American Indians | 0.0 /100 | #290 | Tragic 5.7% |
| Portuguese | 0.0 /100 | #291 | Tragic 5.7% |
| U.S. Virgin Islanders | 0.0 /100 | #292 | Tragic 5.8% |
Demographics Similar to Immigrants from Southern Europe by Unemployment Among Ages 65 to 74 years
In terms of unemployment among ages 65 to 74 years, the demographic groups most similar to Immigrants from Southern Europe are Native Hawaiian (5.6%, a difference of 0.12%), Immigrants from Western Africa (5.6%, a difference of 0.16%), Immigrants from Haiti (5.6%, a difference of 0.22%), Sierra Leonean (5.6%, a difference of 0.24%), and Immigrants from Barbados (5.6%, a difference of 0.26%).
| Demographics | Rating | Rank | Unemployment Among Ages 65 to 74 years |
| Cape Verdeans | 0.7 /100 | #250 | Tragic 5.6% |
| Brazilians | 0.5 /100 | #251 | Tragic 5.6% |
| Colombians | 0.5 /100 | #252 | Tragic 5.6% |
| Immigrants | Brazil | 0.5 /100 | #253 | Tragic 5.6% |
| Immigrants | Costa Rica | 0.5 /100 | #254 | Tragic 5.6% |
| Immigrants | Haiti | 0.4 /100 | #255 | Tragic 5.6% |
| Native Hawaiians | 0.4 /100 | #256 | Tragic 5.6% |
| Immigrants | Southern Europe | 0.3 /100 | #257 | Tragic 5.6% |
| Immigrants | Western Africa | 0.3 /100 | #258 | Tragic 5.6% |
| Sierra Leoneans | 0.2 /100 | #259 | Tragic 5.6% |
| Immigrants | Barbados | 0.2 /100 | #260 | Tragic 5.6% |
| South Americans | 0.2 /100 | #261 | Tragic 5.6% |
| Immigrants | St. Vincent and the Grenadines | 0.2 /100 | #262 | Tragic 5.6% |
| Immigrants | Jamaica | 0.2 /100 | #263 | Tragic 5.6% |
| Pueblo | 0.2 /100 | #264 | Tragic 5.6% |