Immigrants from Sierra Leone vs Immigrants from North America Unemployment Among Ages 45 to 54 years
COMPARE
Immigrants from Sierra Leone
Immigrants from North America
Unemployment Among Ages 45 to 54 years
Unemployment Among Ages 45 to 54 years Comparison
Immigrants from Sierra Leone
Immigrants from North America
4.6%
UNEMPLOYMENT AMONG AGES 45 TO 54 YEARS
36.3/ 100
METRIC RATING
188th/ 347
METRIC RANK
4.4%
UNEMPLOYMENT AMONG AGES 45 TO 54 YEARS
93.9/ 100
METRIC RATING
101st/ 347
METRIC RANK
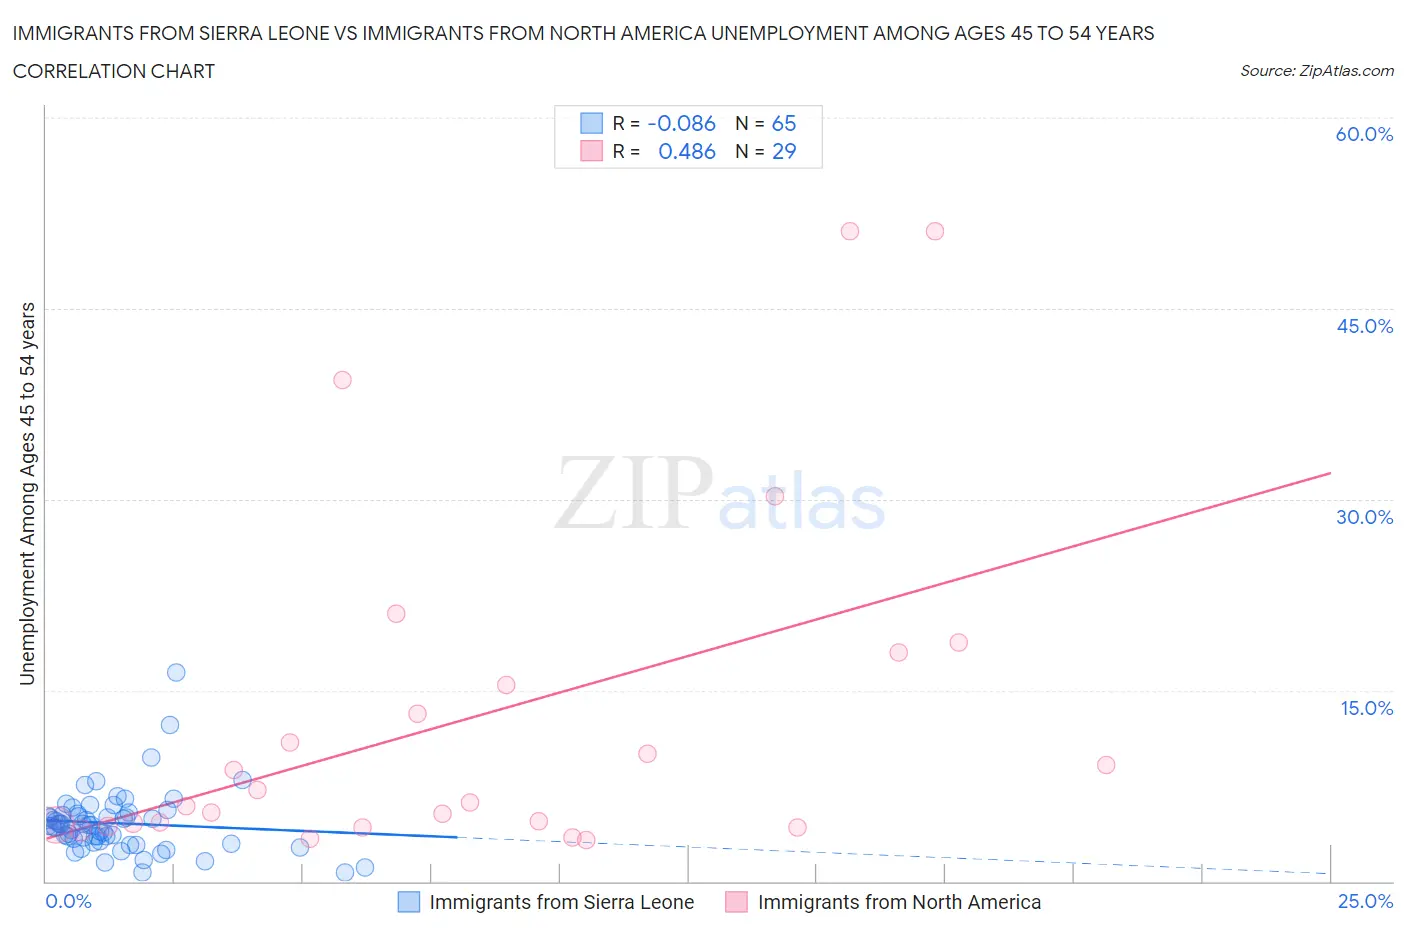
Immigrants from Sierra Leone vs Immigrants from North America Unemployment Among Ages 45 to 54 years Correlation Chart
The statistical analysis conducted on geographies consisting of 100,959,310 people shows a slight negative correlation between the proportion of Immigrants from Sierra Leone and unemployment rate among population between the ages 45 and 54 in the United States with a correlation coefficient (R) of -0.086 and weighted average of 4.6%. Similarly, the statistical analysis conducted on geographies consisting of 444,829,430 people shows a moderate positive correlation between the proportion of Immigrants from North America and unemployment rate among population between the ages 45 and 54 in the United States with a correlation coefficient (R) of 0.486 and weighted average of 4.4%, a difference of 4.0%.
Unemployment Among Ages 45 to 54 years Correlation Summary
| Measurement | Immigrants from Sierra Leone | Immigrants from North America |
| Minimum | 0.70% | 3.2% |
| Maximum | 16.4% | 51.1% |
| Range | 15.7% | 47.9% |
| Mean | 4.6% | 12.8% |
| Median | 4.4% | 6.2% |
| Interquartile 25% (IQ1) | 3.1% | 4.3% |
| Interquartile 75% (IQ3) | 5.3% | 16.7% |
| Interquartile Range (IQR) | 2.2% | 12.4% |
| Standard Deviation (Sample) | 2.5% | 13.6% |
| Standard Deviation (Population) | 2.5% | 13.4% |
Similar Demographics by Unemployment Among Ages 45 to 54 years
Demographics Similar to Immigrants from Sierra Leone by Unemployment Among Ages 45 to 54 years
In terms of unemployment among ages 45 to 54 years, the demographic groups most similar to Immigrants from Sierra Leone are Immigrants from Ukraine (4.5%, a difference of 0.030%), Immigrants from Laos (4.6%, a difference of 0.030%), Immigrants from Serbia (4.6%, a difference of 0.080%), Immigrants from Uruguay (4.6%, a difference of 0.10%), and Immigrants from Thailand (4.6%, a difference of 0.11%).
| Demographics | Rating | Rank | Unemployment Among Ages 45 to 54 years |
| Immigrants | Poland | 47.0 /100 | #181 | Average 4.5% |
| Immigrants | China | 46.7 /100 | #182 | Average 4.5% |
| Sierra Leoneans | 46.7 /100 | #183 | Average 4.5% |
| Immigrants | Hong Kong | 45.9 /100 | #184 | Average 4.5% |
| Immigrants | Philippines | 41.0 /100 | #185 | Average 4.5% |
| Hawaiians | 39.1 /100 | #186 | Fair 4.5% |
| Immigrants | Ukraine | 36.8 /100 | #187 | Fair 4.5% |
| Immigrants | Sierra Leone | 36.3 /100 | #188 | Fair 4.6% |
| Immigrants | Laos | 35.7 /100 | #189 | Fair 4.6% |
| Immigrants | Serbia | 34.8 /100 | #190 | Fair 4.6% |
| Immigrants | Uruguay | 34.4 /100 | #191 | Fair 4.6% |
| Immigrants | Thailand | 34.1 /100 | #192 | Fair 4.6% |
| Immigrants | Lithuania | 33.2 /100 | #193 | Fair 4.6% |
| South Americans | 32.9 /100 | #194 | Fair 4.6% |
| Peruvians | 31.5 /100 | #195 | Fair 4.6% |
Demographics Similar to Immigrants from North America by Unemployment Among Ages 45 to 54 years
In terms of unemployment among ages 45 to 54 years, the demographic groups most similar to Immigrants from North America are Sri Lankan (4.4%, a difference of 0.050%), Icelander (4.4%, a difference of 0.080%), Immigrants from Sweden (4.4%, a difference of 0.18%), Immigrants from Eritrea (4.4%, a difference of 0.19%), and Immigrants from Kenya (4.4%, a difference of 0.21%).
| Demographics | Rating | Rank | Unemployment Among Ages 45 to 54 years |
| Immigrants | Malaysia | 96.2 /100 | #94 | Exceptional 4.4% |
| Immigrants | Ethiopia | 96.1 /100 | #95 | Exceptional 4.4% |
| Indonesians | 95.4 /100 | #96 | Exceptional 4.4% |
| Immigrants | Canada | 95.0 /100 | #97 | Exceptional 4.4% |
| Romanians | 94.9 /100 | #98 | Exceptional 4.4% |
| Immigrants | Burma/Myanmar | 94.9 /100 | #99 | Exceptional 4.4% |
| Immigrants | Eritrea | 94.7 /100 | #100 | Exceptional 4.4% |
| Immigrants | North America | 93.9 /100 | #101 | Exceptional 4.4% |
| Sri Lankans | 93.7 /100 | #102 | Exceptional 4.4% |
| Icelanders | 93.5 /100 | #103 | Exceptional 4.4% |
| Immigrants | Sweden | 93.0 /100 | #104 | Exceptional 4.4% |
| Immigrants | Kenya | 92.8 /100 | #105 | Exceptional 4.4% |
| Iranians | 92.5 /100 | #106 | Exceptional 4.4% |
| Immigrants | South Africa | 92.5 /100 | #107 | Exceptional 4.4% |
| Russians | 92.1 /100 | #108 | Exceptional 4.4% |