Immigrants from Serbia vs Immigrants from Korea Unemployment
COMPARE
Immigrants from Serbia
Immigrants from Korea
Unemployment
Unemployment Comparison
Immigrants from Serbia
Immigrants from Korea
5.0%
UNEMPLOYMENT
95.6/ 100
METRIC RATING
95th/ 347
METRIC RANK
5.0%
UNEMPLOYMENT
96.6/ 100
METRIC RATING
88th/ 347
METRIC RANK
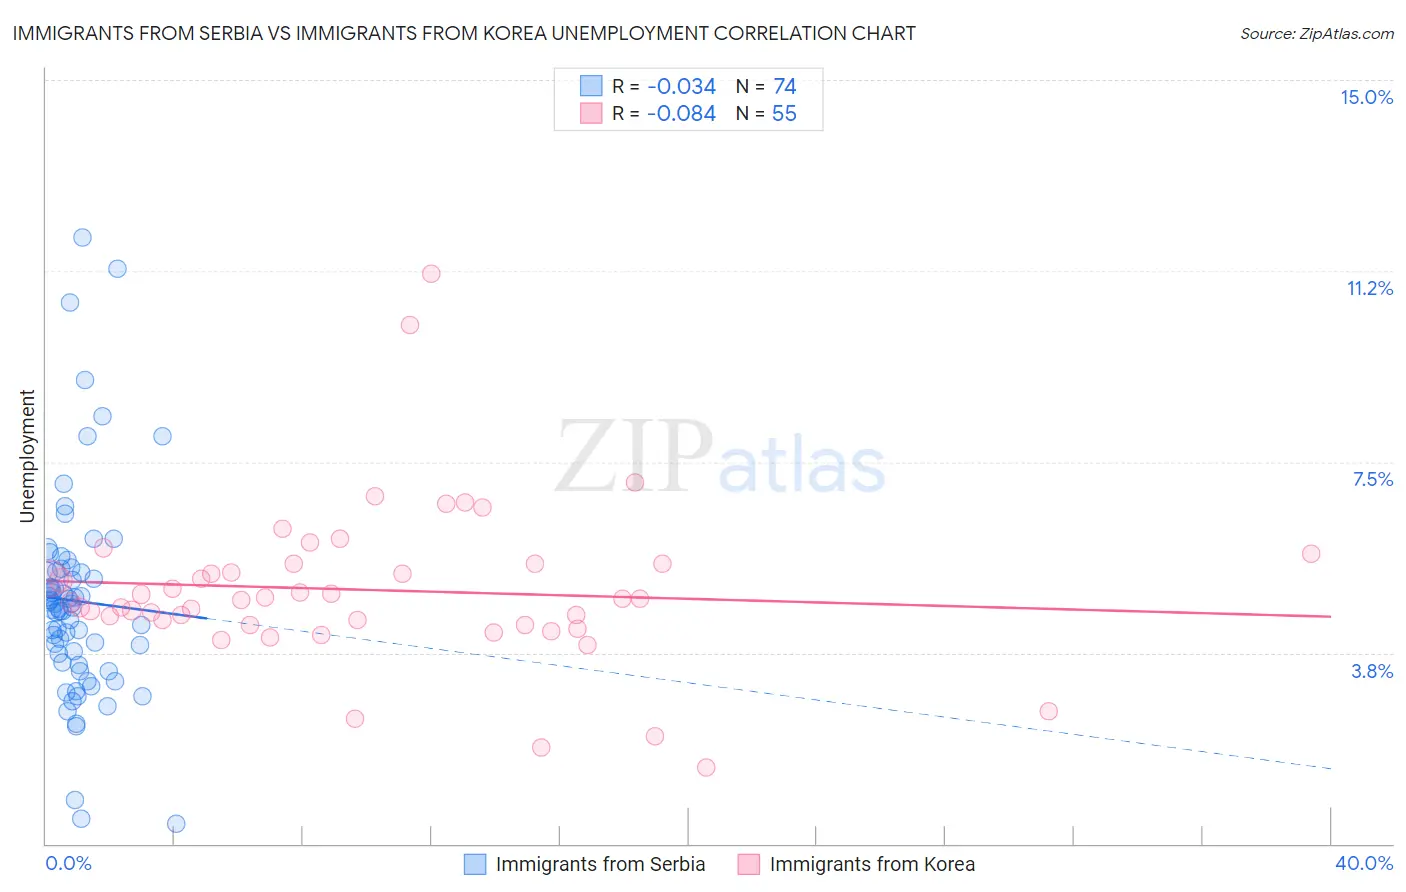
Immigrants from Serbia vs Immigrants from Korea Unemployment Correlation Chart
The statistical analysis conducted on geographies consisting of 131,730,582 people shows no correlation between the proportion of Immigrants from Serbia and unemployment in the United States with a correlation coefficient (R) of -0.034 and weighted average of 5.0%. Similarly, the statistical analysis conducted on geographies consisting of 415,935,417 people shows a slight negative correlation between the proportion of Immigrants from Korea and unemployment in the United States with a correlation coefficient (R) of -0.084 and weighted average of 5.0%, a difference of 0.42%.
Unemployment Correlation Summary
| Measurement | Immigrants from Serbia | Immigrants from Korea |
| Minimum | 0.40% | 1.5% |
| Maximum | 11.9% | 11.2% |
| Range | 11.5% | 9.7% |
| Mean | 4.8% | 5.0% |
| Median | 4.6% | 4.8% |
| Interquartile 25% (IQ1) | 3.6% | 4.3% |
| Interquartile 75% (IQ3) | 5.4% | 5.5% |
| Interquartile Range (IQR) | 1.8% | 1.2% |
| Standard Deviation (Sample) | 2.1% | 1.6% |
| Standard Deviation (Population) | 2.1% | 1.6% |
Demographics Similar to Immigrants from Serbia and Immigrants from Korea by Unemployment
In terms of unemployment, the demographic groups most similar to Immigrants from Serbia are Immigrants from Austria (5.0%, a difference of 0.13%), Immigrants from England (5.0%, a difference of 0.16%), Ukrainian (5.0%, a difference of 0.17%), Immigrants from Czechoslovakia (5.0%, a difference of 0.19%), and Romanian (5.0%, a difference of 0.22%). Similarly, the demographic groups most similar to Immigrants from Korea are Immigrants from Moldova (5.0%, a difference of 0.030%), Jordanian (5.0%, a difference of 0.090%), Immigrants from North Macedonia (5.0%, a difference of 0.13%), Immigrants from Sudan (5.0%, a difference of 0.14%), and Immigrants from South Africa (5.0%, a difference of 0.16%).
| Demographics | Rating | Rank | Unemployment |
| Basques | 97.6 /100 | #81 | Exceptional 5.0% |
| Fijians | 97.6 /100 | #82 | Exceptional 5.0% |
| Hmong | 97.6 /100 | #83 | Exceptional 5.0% |
| Russians | 97.4 /100 | #84 | Exceptional 5.0% |
| Immigrants | Australia | 97.0 /100 | #85 | Exceptional 5.0% |
| Hungarians | 96.9 /100 | #86 | Exceptional 5.0% |
| Immigrants | Moldova | 96.6 /100 | #87 | Exceptional 5.0% |
| Immigrants | Korea | 96.6 /100 | #88 | Exceptional 5.0% |
| Jordanians | 96.4 /100 | #89 | Exceptional 5.0% |
| Immigrants | North Macedonia | 96.3 /100 | #90 | Exceptional 5.0% |
| Immigrants | Sudan | 96.3 /100 | #91 | Exceptional 5.0% |
| Immigrants | South Africa | 96.2 /100 | #92 | Exceptional 5.0% |
| Ukrainians | 96.0 /100 | #93 | Exceptional 5.0% |
| Immigrants | Austria | 95.9 /100 | #94 | Exceptional 5.0% |
| Immigrants | Serbia | 95.6 /100 | #95 | Exceptional 5.0% |
| Immigrants | England | 95.2 /100 | #96 | Exceptional 5.0% |
| Immigrants | Czechoslovakia | 95.1 /100 | #97 | Exceptional 5.0% |
| Romanians | 95.0 /100 | #98 | Exceptional 5.0% |
| Mongolians | 94.8 /100 | #99 | Exceptional 5.0% |
| Estonians | 94.6 /100 | #100 | Exceptional 5.0% |
| Americans | 94.3 /100 | #101 | Exceptional 5.0% |