Immigrants from Serbia vs Comanche Unemployment Among Women with Children Under 18 years
COMPARE
Immigrants from Serbia
Comanche
Unemployment Among Women with Children Under 18 years
Unemployment Among Women with Children Under 18 years Comparison
Immigrants from Serbia
Comanche
5.1%
UNEMPLOYMENT AMONG WOMEN WITH CHILDREN UNDER 18 YEARS
98.2/ 100
METRIC RATING
54th/ 347
METRIC RANK
6.1%
UNEMPLOYMENT AMONG WOMEN WITH CHILDREN UNDER 18 YEARS
0.1/ 100
METRIC RATING
264th/ 347
METRIC RANK
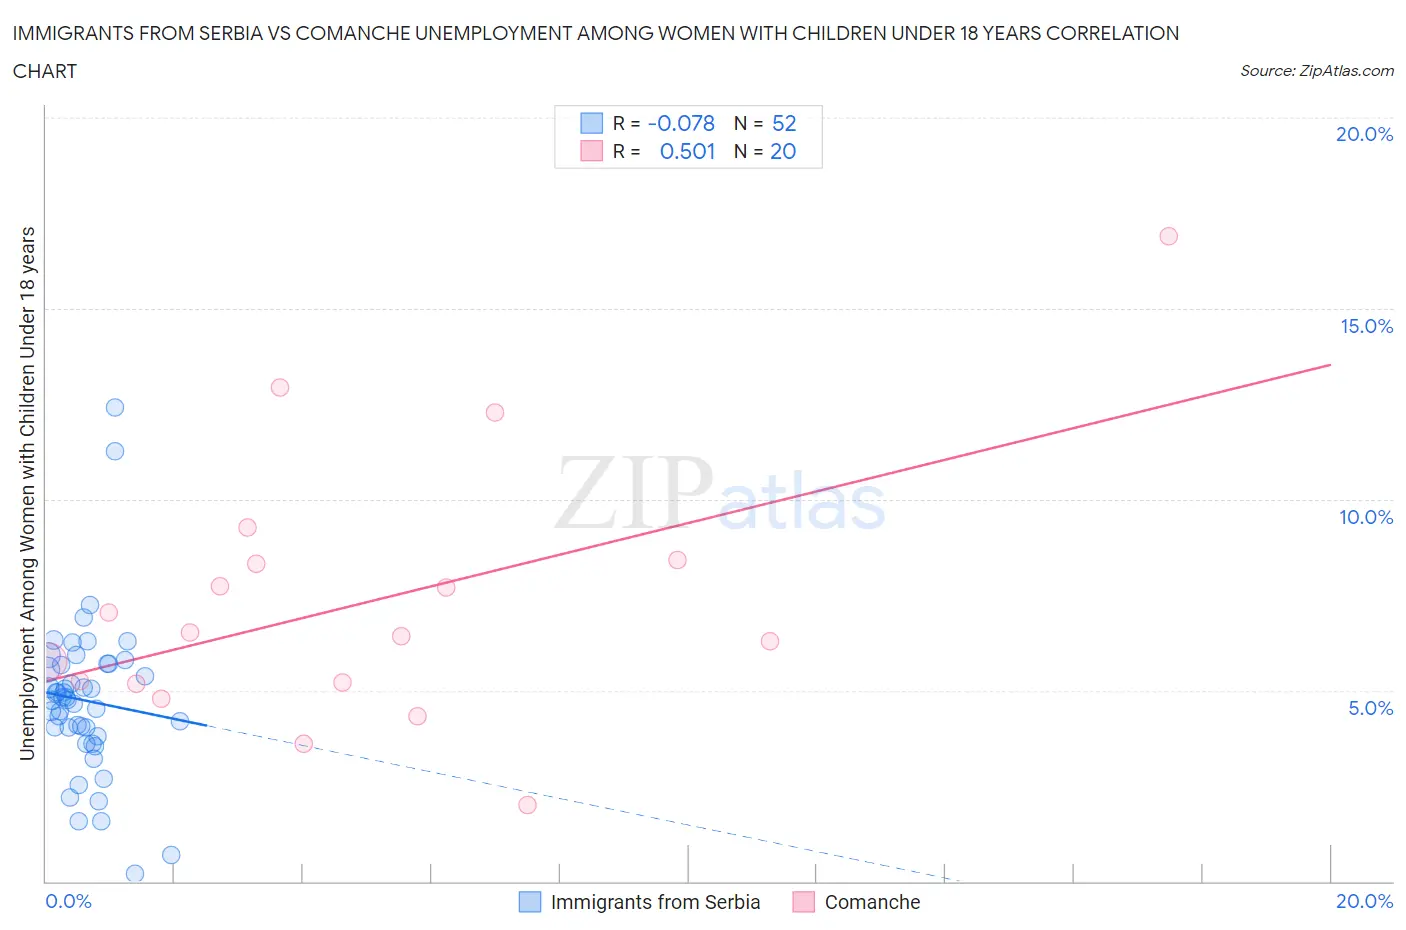
Immigrants from Serbia vs Comanche Unemployment Among Women with Children Under 18 years Correlation Chart
The statistical analysis conducted on geographies consisting of 129,807,496 people shows a slight negative correlation between the proportion of Immigrants from Serbia and unemployment rate among women with children under the age of 18 in the United States with a correlation coefficient (R) of -0.078 and weighted average of 5.1%. Similarly, the statistical analysis conducted on geographies consisting of 107,484,576 people shows a substantial positive correlation between the proportion of Comanche and unemployment rate among women with children under the age of 18 in the United States with a correlation coefficient (R) of 0.501 and weighted average of 6.1%, a difference of 21.3%.
Unemployment Among Women with Children Under 18 years Correlation Summary
| Measurement | Immigrants from Serbia | Comanche |
| Minimum | 0.20% | 2.0% |
| Maximum | 12.4% | 16.9% |
| Range | 12.2% | 14.9% |
| Mean | 4.7% | 7.3% |
| Median | 4.8% | 6.5% |
| Interquartile 25% (IQ1) | 3.9% | 5.2% |
| Interquartile 75% (IQ3) | 5.7% | 8.3% |
| Interquartile Range (IQR) | 1.8% | 3.2% |
| Standard Deviation (Sample) | 2.1% | 3.5% |
| Standard Deviation (Population) | 2.1% | 3.4% |
Similar Demographics by Unemployment Among Women with Children Under 18 years
Demographics Similar to Immigrants from Serbia by Unemployment Among Women with Children Under 18 years
In terms of unemployment among women with children under 18 years, the demographic groups most similar to Immigrants from Serbia are Scottish (5.1%, a difference of 0.030%), Yugoslavian (5.1%, a difference of 0.12%), Immigrants from Nepal (5.1%, a difference of 0.12%), Immigrants from Sri Lanka (5.1%, a difference of 0.13%), and Immigrants from Ireland (5.1%, a difference of 0.17%).
| Demographics | Rating | Rank | Unemployment Among Women with Children Under 18 years |
| British | 98.7 /100 | #47 | Exceptional 5.0% |
| Northern Europeans | 98.6 /100 | #48 | Exceptional 5.0% |
| Lithuanians | 98.4 /100 | #49 | Exceptional 5.0% |
| Immigrants | Japan | 98.4 /100 | #50 | Exceptional 5.0% |
| Yugoslavians | 98.3 /100 | #51 | Exceptional 5.1% |
| Immigrants | Nepal | 98.3 /100 | #52 | Exceptional 5.1% |
| Scottish | 98.2 /100 | #53 | Exceptional 5.1% |
| Immigrants | Serbia | 98.2 /100 | #54 | Exceptional 5.1% |
| Immigrants | Sri Lanka | 98.1 /100 | #55 | Exceptional 5.1% |
| Immigrants | Ireland | 98.0 /100 | #56 | Exceptional 5.1% |
| Czechoslovakians | 98.0 /100 | #57 | Exceptional 5.1% |
| Immigrants | Belgium | 97.9 /100 | #58 | Exceptional 5.1% |
| Asians | 97.9 /100 | #59 | Exceptional 5.1% |
| Welsh | 97.7 /100 | #60 | Exceptional 5.1% |
| Russians | 97.5 /100 | #61 | Exceptional 5.1% |
Demographics Similar to Comanche by Unemployment Among Women with Children Under 18 years
In terms of unemployment among women with children under 18 years, the demographic groups most similar to Comanche are Spanish American Indian (6.1%, a difference of 0.070%), Immigrants from Liberia (6.1%, a difference of 0.090%), Immigrants from Trinidad and Tobago (6.1%, a difference of 0.090%), Immigrants from Bahamas (6.1%, a difference of 0.16%), and Nigerian (6.1%, a difference of 0.19%).
| Demographics | Rating | Rank | Unemployment Among Women with Children Under 18 years |
| Bermudans | 0.1 /100 | #257 | Tragic 6.1% |
| Immigrants | Nigeria | 0.1 /100 | #258 | Tragic 6.1% |
| Ottawa | 0.1 /100 | #259 | Tragic 6.1% |
| Nigerians | 0.1 /100 | #260 | Tragic 6.1% |
| Immigrants | Liberia | 0.1 /100 | #261 | Tragic 6.1% |
| Immigrants | Trinidad and Tobago | 0.1 /100 | #262 | Tragic 6.1% |
| Spanish American Indians | 0.1 /100 | #263 | Tragic 6.1% |
| Comanche | 0.1 /100 | #264 | Tragic 6.1% |
| Immigrants | Bahamas | 0.1 /100 | #265 | Tragic 6.1% |
| Sub-Saharan Africans | 0.1 /100 | #266 | Tragic 6.2% |
| French American Indians | 0.1 /100 | #267 | Tragic 6.2% |
| Trinidadians and Tobagonians | 0.1 /100 | #268 | Tragic 6.2% |
| Cajuns | 0.1 /100 | #269 | Tragic 6.2% |
| Ghanaians | 0.1 /100 | #270 | Tragic 6.2% |
| Central Americans | 0.0 /100 | #271 | Tragic 6.2% |