Immigrants from Romania vs South American Unemployment Among Ages 16 to 19 years

COMPARE

Immigrants from Romania
Race
Ancestry
AfghanAfricanAlaska NativeAlaskan AthabascanAlbanianAleutAlsatianAmericanApacheArabArapahoArgentineanArmenianAssyrian/Chaldean/SyriacAustralianAustrianBahamianBangladeshiBarbadianBasqueBelgianBelizeanBermudanBhutaneseBlackfeetBolivianBrazilianBritishBritish West IndianBulgarianBurmeseCajunCambodianCanadianCape VerdeanCarpatho RusynCelticCentral AmericanCentral American IndianCherokeeCheyenneChickasawChileanChineseChippewaChoctawColombianColvilleComancheCosta RicanCreeCreekCroatianCrowCubanCypriotCzechCzechoslovakianDanishDelawareDominicanDutchDutch West IndianEastern EuropeanEcuadorianEgyptianEnglishEstonianEthiopianEuropeanFijianFilipinoFinnishFrenchFrench American IndianFrench CanadianGermanGerman RussianGhanaianGreekGuamanian/ChamorroGuatemalanGuyaneseHaitianHmongHonduranHopiHoumaHungarianIcelanderIndian (Asian)IndonesianInupiatIranianIraqiIrishIroquoisIsraeliItalianJamaicanJapaneseJordanianKenyanKiowaKoreanLaotianLatvianLebaneseLiberianLithuanianLumbeeLuxembourgerMacedonianMalaysianMalteseMarshalleseMenomineeMexicanMexican American IndianMongolianMoroccanNative HawaiianNavajoNepaleseNew ZealanderNicaraguanNigerianNorthern EuropeanNorwegianOkinawanOsageOttawaPaiutePakistaniPalestinianPanamanianParaguayanPennsylvania GermanPeruvianPimaPolishPortuguesePotawatomiPuebloPuerto RicanPuget Sound SalishRomanianRussianSalvadoranSamoanScandinavianScotch-IrishScottishSeminoleSenegaleseSerbianShoshoneSierra LeoneanSiouxSlavicSlovakSloveneSomaliSouth AfricanSouth American IndianSoviet UnionSpaniardSpanishSpanish AmericanSpanish American IndianSri LankanSubsaharan AfricanSudaneseSwedishSwissSyrianTaiwaneseThaiTlingit-HaidaTohono O'OdhamTonganTrinidadian and TobagonianTsimshianTurkishU.S. Virgin IslanderUgandanUkrainianUruguayanUteVenezuelanVietnameseWelshWest IndianYakamaYaquiYugoslavianYumanYup'ikZimbabwean
Immigration
NonimmigrantsImmigrantsAfghanistanAfricaAlbaniaArgentinaArmeniaAsiaAustraliaAustriaBahamasBangladeshBarbadosBelarusBelgiumBelizeBoliviaBosnia and HerzegovinaBrazilBulgariaBurma/MyanmarCabo VerdeCambodiaCameroonCanadaCaribbeanCentral AmericaChileChinaColombiaCongoCosta RicaCroatiaCubaCzechoslovakiaDenmarkDominicaDominican RepublicEastern AfricaEastern AsiaEastern EuropeEcuadorEgyptEl SalvadorEnglandEritreaEthiopiaEuropeFijiFranceGermanyGhanaGreeceGrenadaGuatemalaGuyanaHaitiHondurasHong KongHungaryIndiaIndonesiaIranIraqIrelandIsraelItalyJamaicaJapanJordanKazakhstanKenyaKoreaKuwaitLaosLatin AmericaLatviaLebanonLiberiaLithuaniaMalaysiaMexicoMicronesiaMiddle AfricaMoldovaMoroccoNepalNetherlandsNicaraguaNigeriaNorth AmericaNorth MacedoniaNorthern AfricaNorthern EuropeNorwayOceaniaPakistanPanamaPeruPhilippinesPolandPortugalRomaniaRussiaSaudi ArabiaScotlandSenegalSerbiaSierra LeoneSingaporeSomaliaSouth AfricaSouth AmericaSouth Central AsiaSouth Eastern AsiaSouthern EuropeSpainSri LankaSt. Vincent and the GrenadinesSudanSwedenSwitzerlandSyriaTaiwanThailandTrinidad and TobagoTurkeyUgandaUkraineUruguayUzbekistanVenezuelaVietnamWest IndiesWestern AfricaWestern AsiaWestern EuropeYemenZaireZimbabweAzores
South American
Race
Ancestry
AfghanAfricanAlaska NativeAlaskan AthabascanAlbanianAleutAlsatianAmericanApacheArabArapahoArgentineanArmenianAssyrian/Chaldean/SyriacAustralianAustrianBahamianBangladeshiBarbadianBasqueBelgianBelizeanBermudanBhutaneseBlackfeetBolivianBrazilianBritishBritish West IndianBulgarianBurmeseCajunCambodianCanadianCape VerdeanCarpatho RusynCelticCentral AmericanCentral American IndianCherokeeCheyenneChickasawChileanChineseChippewaChoctawColombianColvilleComancheCosta RicanCreeCreekCroatianCrowCubanCypriotCzechCzechoslovakianDanishDelawareDominicanDutchDutch West IndianEastern EuropeanEcuadorianEgyptianEnglishEstonianEthiopianEuropeanFijianFilipinoFinnishFrenchFrench American IndianFrench CanadianGermanGerman RussianGhanaianGreekGuamanian/ChamorroGuatemalanGuyaneseHaitianHmongHonduranHopiHoumaHungarianIcelanderIndian (Asian)IndonesianInupiatIranianIraqiIrishIroquoisIsraeliItalianJamaicanJapaneseJordanianKenyanKiowaKoreanLaotianLatvianLebaneseLiberianLithuanianLumbeeLuxembourgerMacedonianMalaysianMalteseMarshalleseMenomineeMexicanMexican American IndianMongolianMoroccanNative HawaiianNavajoNepaleseNew ZealanderNicaraguanNigerianNorthern EuropeanNorwegianOkinawanOsageOttawaPaiutePakistaniPalestinianPanamanianParaguayanPennsylvania GermanPeruvianPimaPolishPortuguesePotawatomiPuebloPuerto RicanPuget Sound SalishRomanianRussianSalvadoranSamoanScandinavianScotch-IrishScottishSeminoleSenegaleseSerbianShoshoneSierra LeoneanSiouxSlavicSlovakSloveneSomaliSouth AfricanSouth AmericanSouth American IndianSoviet UnionSpaniardSpanishSpanish AmericanSpanish American IndianSri LankanSubsaharan AfricanSudaneseSwedishSwissSyrianTaiwaneseThaiTlingit-HaidaTohono O'OdhamTonganTrinidadian and TobagonianTsimshianTurkishU.S. Virgin IslanderUgandanUkrainianUruguayanUteVenezuelanVietnameseWelshWest IndianYakamaYaquiYugoslavianYumanYup'ikZimbabwean
Immigration
NonimmigrantsImmigrantsAfghanistanAfricaAlbaniaArgentinaArmeniaAsiaAustraliaAustriaBahamasBangladeshBarbadosBelarusBelgiumBelizeBoliviaBosnia and HerzegovinaBrazilBulgariaBurma/MyanmarCabo VerdeCambodiaCameroonCanadaCaribbeanCentral AmericaChileChinaColombiaCongoCosta RicaCroatiaCubaCzechoslovakiaDenmarkDominicaDominican RepublicEastern AfricaEastern AsiaEastern EuropeEcuadorEgyptEl SalvadorEnglandEritreaEthiopiaEuropeFijiFranceGermanyGhanaGreeceGrenadaGuatemalaGuyanaHaitiHondurasHong KongHungaryIndiaIndonesiaIranIraqIrelandIsraelItalyJamaicaJapanJordanKazakhstanKenyaKoreaKuwaitLaosLatin AmericaLatviaLebanonLiberiaLithuaniaMalaysiaMexicoMicronesiaMiddle AfricaMoldovaMoroccoNepalNetherlandsNicaraguaNigeriaNorth AmericaNorth MacedoniaNorthern AfricaNorthern EuropeNorwayOceaniaPakistanPanamaPeruPhilippinesPolandPortugalRussiaSaudi ArabiaScotlandSenegalSerbiaSierra LeoneSingaporeSomaliaSouth AfricaSouth AmericaSouth Central AsiaSouth Eastern AsiaSouthern EuropeSpainSri LankaSt. Vincent and the GrenadinesSudanSwedenSwitzerlandSyriaTaiwanThailandTrinidad and TobagoTurkeyUgandaUkraineUruguayUzbekistanVenezuelaVietnamWest IndiesWestern AfricaWestern AsiaWestern EuropeYemenZaireZimbabweAzores
Unemployment Among Ages 16 to 19 years
Income
Poverty
Unemployment
Labor Participation
Family Structure
Vehicle Availability
Education Level
Disability

Unemployment Among Ages 16 to 19 years Comparison

Immigrants from Romania

South Americans

Average
Tragic
17.5%
UNEMPLOYMENT AMONG AGES 16 TO 19 YEARS
53.3/ 100
METRIC RATING
170th/ 347
METRIC RANK
18.3%
UNEMPLOYMENT AMONG AGES 16 TO 19 YEARS
2.6/ 100
METRIC RATING
238th/ 347
METRIC RANK

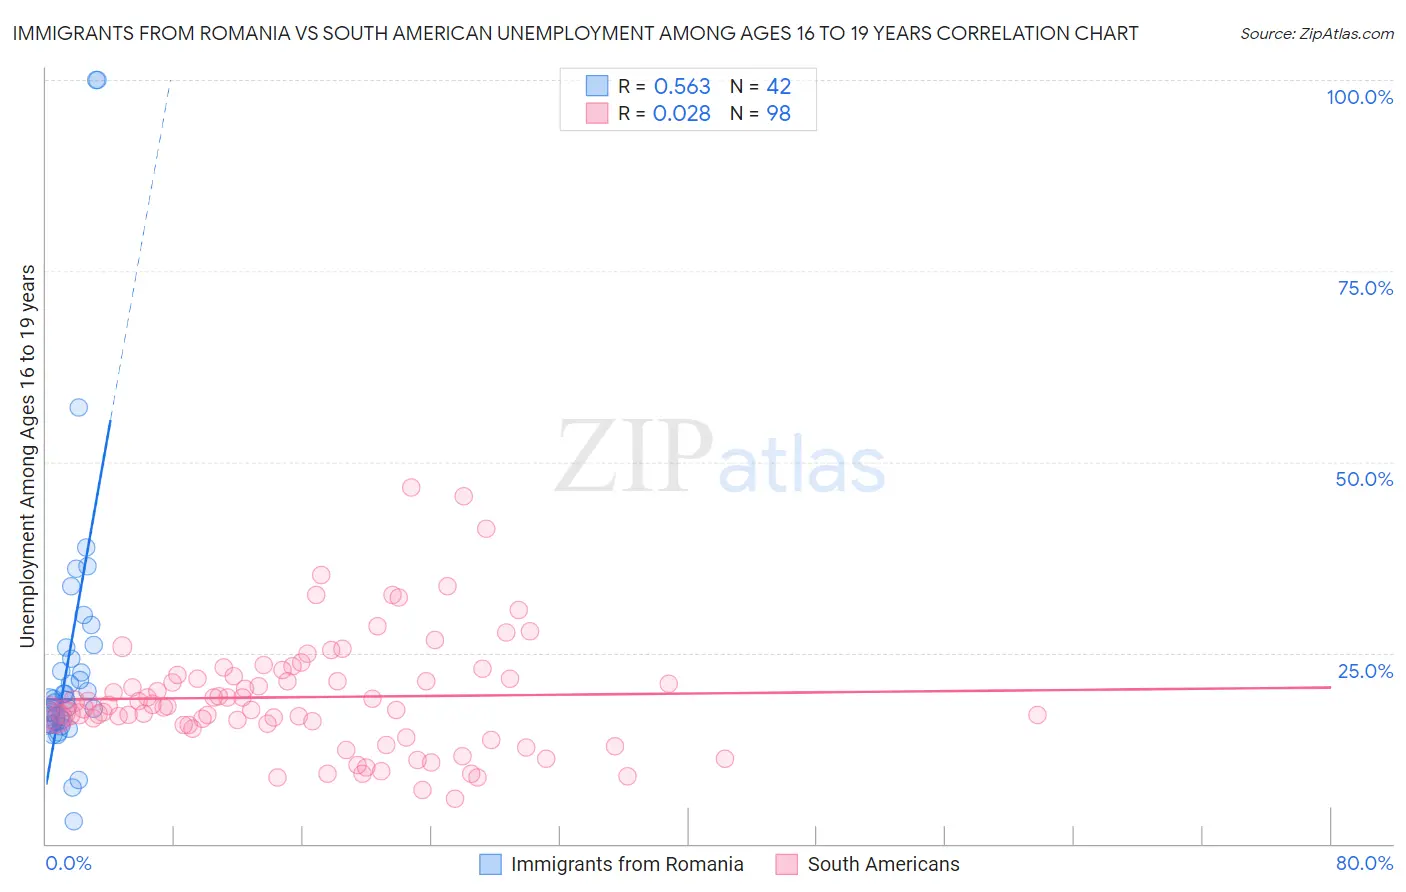
Immigrants from Romania vs South American Unemployment Among Ages 16 to 19 years Correlation Chart

The statistical analysis conducted on geographies consisting of 248,059,296 people shows a substantial positive correlation between the proportion of Immigrants from Romania and unemployment rate among population between the ages 16 and 19 in the United States with a correlation coefficient (R) of 0.563 and weighted average of 17.5%. Similarly, the statistical analysis conducted on geographies consisting of 460,023,329 people shows no correlation between the proportion of South Americans and unemployment rate among population between the ages 16 and 19 in the United States with a correlation coefficient (R) of 0.028 and weighted average of 18.3%, a difference of 4.4%.
Immigrants from Romania vs South American Unemployment Among Ages 16 to 19 years

Unemployment Among Ages 16 to 19 years Correlation Summary

MeasurementImmigrants from RomaniaSouth American
Minimum3.0%5.9%
Maximum100.0%46.6%
Range97.0%40.7%
Mean24.6%19.2%
Median18.8%17.9%
Interquartile 25% (IQ1)16.1%15.6%
Interquartile 75% (IQ3)25.6%21.9%
Interquartile Range (IQR)9.5%6.2%
Standard Deviation (Sample)19.4%7.6%
Standard Deviation (Population)19.2%7.6%

Similar Demographics by Unemployment Among Ages 16 to 19 years

Demographics Similar to Immigrants from Romania by Unemployment Among Ages 16 to 19 years

In terms of unemployment among ages 16 to 19 years, the demographic groups most similar to Immigrants from Romania are Immigrants from Switzerland (17.5%, a difference of 0.0%), Immigrants from Western Europe (17.6%, a difference of 0.050%), Immigrants from Cambodia (17.5%, a difference of 0.060%), Immigrants from Hungary (17.5%, a difference of 0.070%), and Immigrants from France (17.5%, a difference of 0.080%).
DemographicsRating | RankUnemployment Among Ages 16 to 19 years
Egyptians
59.7
/100
|
#163
Average
17.5%
Immigrants | Austria
57.7
/100
|
#164
Average
17.5%
Cape Verdeans
55.8
/100
|
#165
Average
17.5%
Immigrants | Italy
55.2
/100
|
#166
Average
17.5%
Immigrants | France
54.9
/100
|
#167
Average
17.5%
Immigrants | Hungary
54.7
/100
|
#168
Average
17.5%
Immigrants | Cambodia
54.5
/100
|
#169
Average
17.5%
Immigrants | Romania
53.3
/100
|
#170
Average
17.5%
Immigrants | Switzerland
53.2
/100
|
#171
Average
17.5%
Immigrants | Western Europe
52.2
/100
|
#172
Average
17.6%
Chileans
50.8
/100
|
#173
Average
17.6%
Osage
50.0
/100
|
#174
Average
17.6%
Immigrants | Sweden
49.1
/100
|
#175
Average
17.6%
Nicaraguans
48.9
/100
|
#176
Average
17.6%
Bermudans
48.7
/100
|
#177
Average
17.6%

Demographics Similar to South Americans by Unemployment Among Ages 16 to 19 years

In terms of unemployment among ages 16 to 19 years, the demographic groups most similar to South Americans are Immigrants (18.3%, a difference of 0.020%), Immigrants from Colombia (18.3%, a difference of 0.030%), Native Hawaiian (18.3%, a difference of 0.080%), French American Indian (18.3%, a difference of 0.10%), and Immigrants from Cabo Verde (18.4%, a difference of 0.30%).
DemographicsRating | RankUnemployment Among Ages 16 to 19 years
Nepalese
4.2
/100
|
#231
Tragic
18.2%
Immigrants | Russia
4.0
/100
|
#232
Tragic
18.2%
Seminole
4.0
/100
|
#233
Tragic
18.2%
Colombians
3.7
/100
|
#234
Tragic
18.3%
French American Indians
2.9
/100
|
#235
Tragic
18.3%
Immigrants | Colombia
2.7
/100
|
#236
Tragic
18.3%
Immigrants | Immigrants
2.7
/100
|
#237
Tragic
18.3%
South Americans
2.6
/100
|
#238
Tragic
18.3%
Native Hawaiians
2.4
/100
|
#239
Tragic
18.3%
Immigrants | Cabo Verde
2.0
/100
|
#240
Tragic
18.4%
Immigrants | Ukraine
1.3
/100
|
#241
Tragic
18.5%
Moroccans
1.1
/100
|
#242
Tragic
18.5%
Mexicans
0.9
/100
|
#243
Tragic
18.5%
Guatemalans
0.8
/100
|
#244
Tragic
18.6%
Immigrants | Belarus
0.8
/100
|
#245
Tragic
18.6%