Immigrants from Romania vs Indian (Asian) Unemployment Among Ages 45 to 54 years
COMPARE
Immigrants from Romania
Indian (Asian)
Unemployment Among Ages 45 to 54 years
Unemployment Among Ages 45 to 54 years Comparison
Immigrants from Romania
Indians (Asian)
4.4%
UNEMPLOYMENT AMONG AGES 45 TO 54 YEARS
90.0/ 100
METRIC RATING
118th/ 347
METRIC RANK
4.5%
UNEMPLOYMENT AMONG AGES 45 TO 54 YEARS
68.1/ 100
METRIC RATING
157th/ 347
METRIC RANK
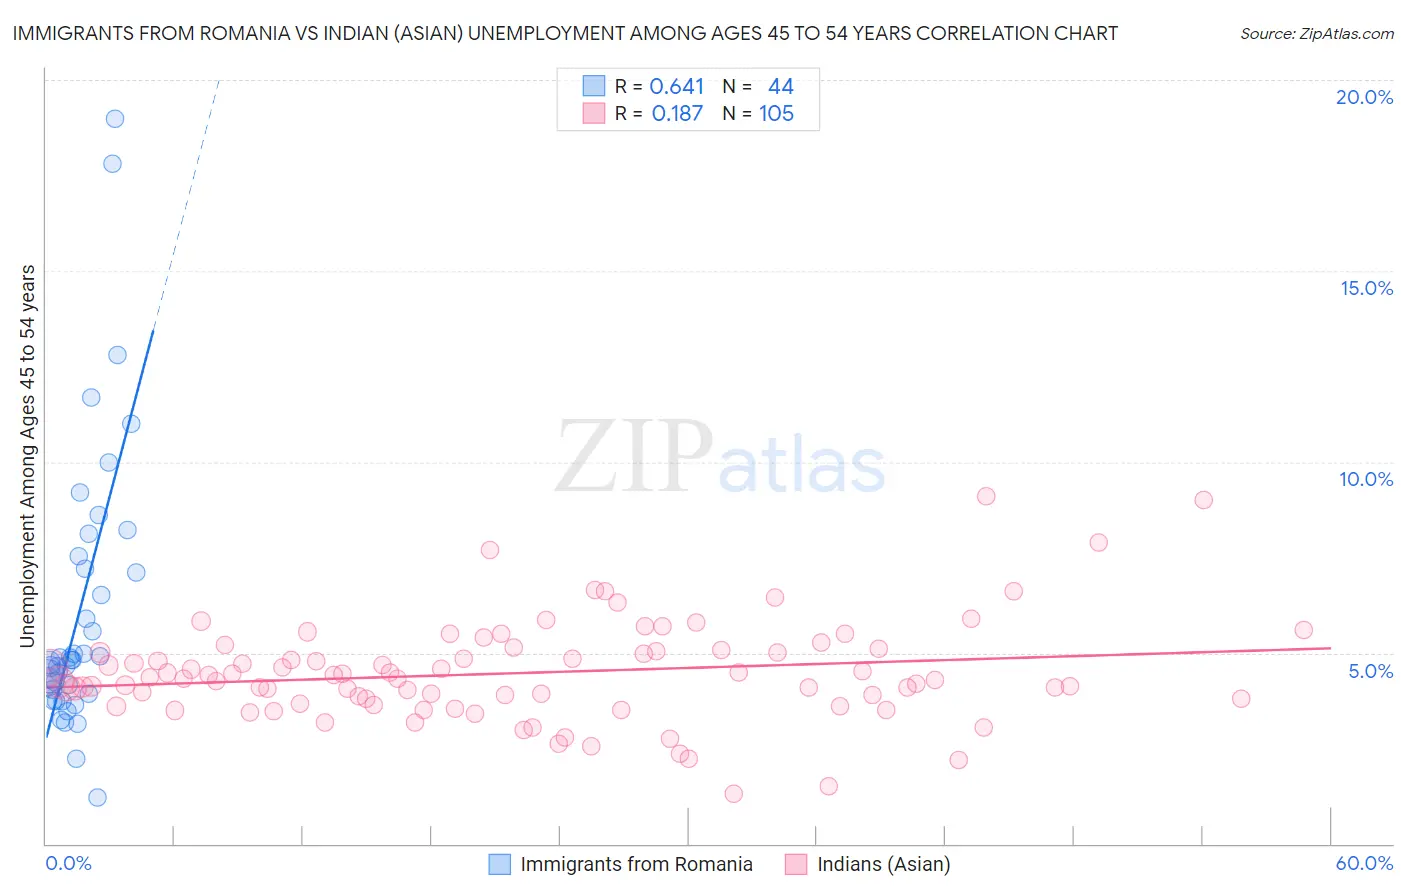
Immigrants from Romania vs Indian (Asian) Unemployment Among Ages 45 to 54 years Correlation Chart
The statistical analysis conducted on geographies consisting of 253,287,738 people shows a significant positive correlation between the proportion of Immigrants from Romania and unemployment rate among population between the ages 45 and 54 in the United States with a correlation coefficient (R) of 0.641 and weighted average of 4.4%. Similarly, the statistical analysis conducted on geographies consisting of 475,616,910 people shows a poor positive correlation between the proportion of Indians (Asian) and unemployment rate among population between the ages 45 and 54 in the United States with a correlation coefficient (R) of 0.187 and weighted average of 4.5%, a difference of 1.7%.
Unemployment Among Ages 45 to 54 years Correlation Summary
| Measurement | Immigrants from Romania | Indian (Asian) |
| Minimum | 1.2% | 1.3% |
| Maximum | 19.0% | 9.1% |
| Range | 17.8% | 7.8% |
| Mean | 6.1% | 4.5% |
| Median | 4.8% | 4.3% |
| Interquartile 25% (IQ1) | 4.0% | 3.7% |
| Interquartile 75% (IQ3) | 7.4% | 5.1% |
| Interquartile Range (IQR) | 3.4% | 1.3% |
| Standard Deviation (Sample) | 3.7% | 1.3% |
| Standard Deviation (Population) | 3.6% | 1.3% |
Similar Demographics by Unemployment Among Ages 45 to 54 years
Demographics Similar to Immigrants from Romania by Unemployment Among Ages 45 to 54 years
In terms of unemployment among ages 45 to 54 years, the demographic groups most similar to Immigrants from Romania are Native Hawaiian (4.4%, a difference of 0.010%), South African (4.4%, a difference of 0.060%), American (4.4%, a difference of 0.060%), Immigrants from Oceania (4.4%, a difference of 0.070%), and Immigrants from Kazakhstan (4.4%, a difference of 0.070%).
| Demographics | Rating | Rank | Unemployment Among Ages 45 to 54 years |
| Immigrants | Nicaragua | 91.3 /100 | #111 | Exceptional 4.4% |
| Immigrants | Saudi Arabia | 91.1 /100 | #112 | Exceptional 4.4% |
| French Canadians | 91.0 /100 | #113 | Exceptional 4.4% |
| Immigrants | Chile | 90.9 /100 | #114 | Exceptional 4.4% |
| Pakistanis | 90.7 /100 | #115 | Exceptional 4.4% |
| Immigrants | North Macedonia | 90.6 /100 | #116 | Exceptional 4.4% |
| South Africans | 90.4 /100 | #117 | Exceptional 4.4% |
| Immigrants | Romania | 90.0 /100 | #118 | Exceptional 4.4% |
| Native Hawaiians | 90.0 /100 | #119 | Excellent 4.4% |
| Americans | 89.6 /100 | #120 | Excellent 4.4% |
| Immigrants | Oceania | 89.5 /100 | #121 | Excellent 4.4% |
| Immigrants | Kazakhstan | 89.5 /100 | #122 | Excellent 4.4% |
| Immigrants | Asia | 88.8 /100 | #123 | Excellent 4.4% |
| Spanish | 88.8 /100 | #124 | Excellent 4.4% |
| Immigrants | Vietnam | 88.6 /100 | #125 | Excellent 4.4% |
Demographics Similar to Indians (Asian) by Unemployment Among Ages 45 to 54 years
In terms of unemployment among ages 45 to 54 years, the demographic groups most similar to Indians (Asian) are Immigrants from Croatia (4.5%, a difference of 0.080%), Marshallese (4.5%, a difference of 0.14%), Immigrants from Italy (4.5%, a difference of 0.14%), Immigrants from Spain (4.5%, a difference of 0.25%), and Korean (4.5%, a difference of 0.28%).
| Demographics | Rating | Rank | Unemployment Among Ages 45 to 54 years |
| Tsimshian | 74.6 /100 | #150 | Good 4.5% |
| Cypriots | 74.4 /100 | #151 | Good 4.5% |
| Koreans | 73.1 /100 | #152 | Good 4.5% |
| Hungarians | 73.0 /100 | #153 | Good 4.5% |
| Immigrants | Spain | 72.5 /100 | #154 | Good 4.5% |
| Marshallese | 70.6 /100 | #155 | Good 4.5% |
| Immigrants | Croatia | 69.6 /100 | #156 | Good 4.5% |
| Indians (Asian) | 68.1 /100 | #157 | Good 4.5% |
| Immigrants | Italy | 65.5 /100 | #158 | Good 4.5% |
| Immigrants | Nonimmigrants | 62.8 /100 | #159 | Good 4.5% |
| Immigrants | South Eastern Asia | 62.0 /100 | #160 | Good 4.5% |
| Immigrants | Eastern Europe | 61.6 /100 | #161 | Good 4.5% |
| Immigrants | Indonesia | 60.3 /100 | #162 | Good 4.5% |
| Bangladeshis | 59.7 /100 | #163 | Average 4.5% |
| Samoans | 58.5 /100 | #164 | Average 4.5% |