Immigrants from Portugal vs Immigrants from Thailand Unemployment Among Women with Children Under 6 years
COMPARE
Immigrants from Portugal
Immigrants from Thailand
Unemployment Among Women with Children Under 6 years
Unemployment Among Women with Children Under 6 years Comparison
Immigrants from Portugal
Immigrants from Thailand
8.3%
UNEMPLOYMENT AMONG WOMEN WITH CHILDREN UNDER 6 YEARS
0.6/ 100
METRIC RATING
255th/ 347
METRIC RANK
7.7%
UNEMPLOYMENT AMONG WOMEN WITH CHILDREN UNDER 6 YEARS
38.5/ 100
METRIC RATING
187th/ 347
METRIC RANK
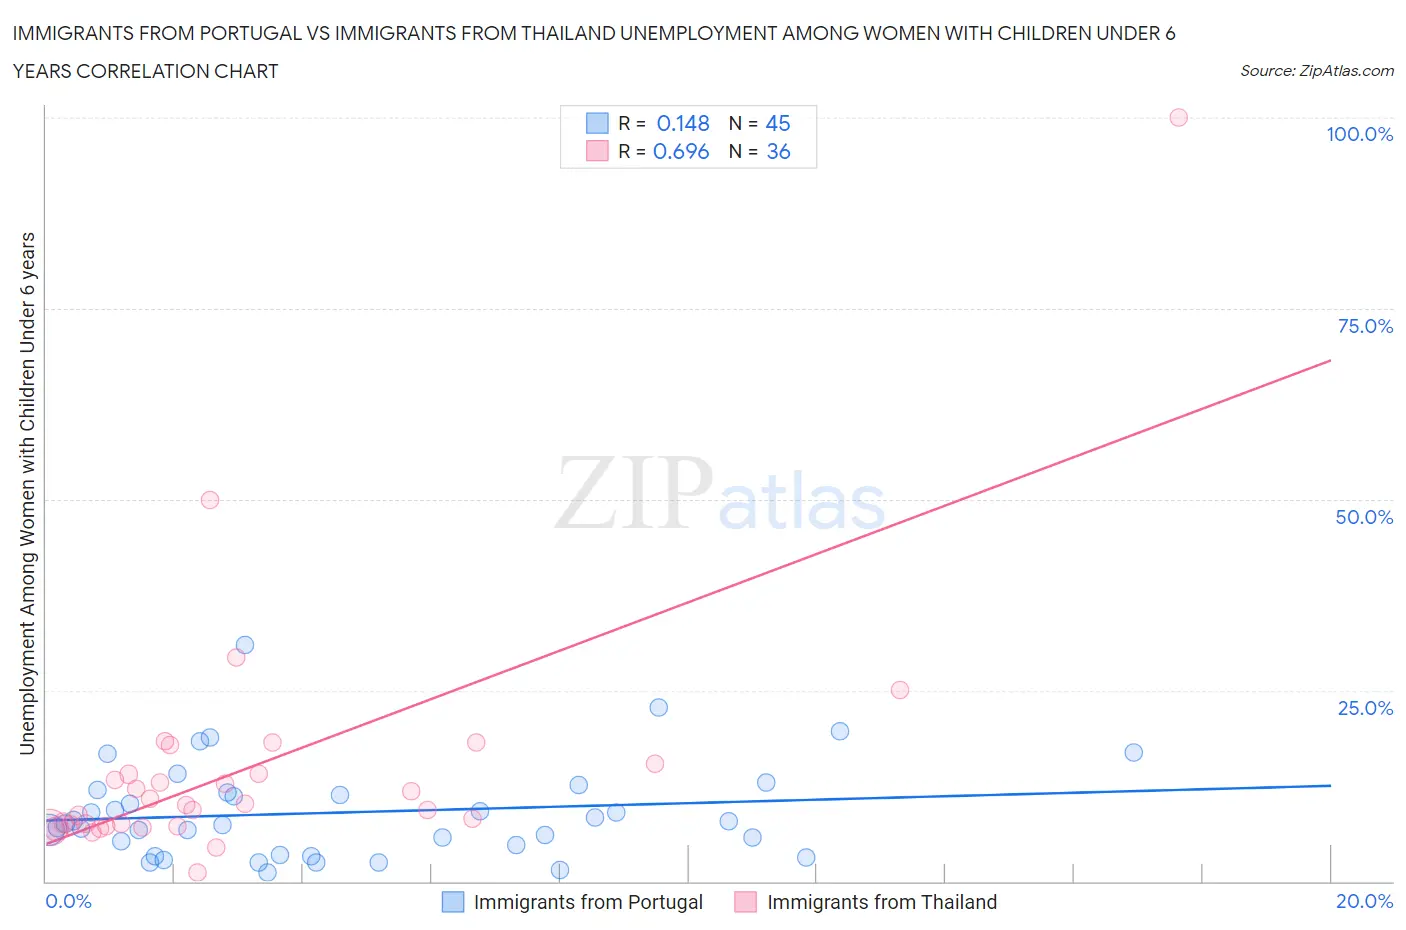
Immigrants from Portugal vs Immigrants from Thailand Unemployment Among Women with Children Under 6 years Correlation Chart
The statistical analysis conducted on geographies consisting of 145,443,316 people shows a poor positive correlation between the proportion of Immigrants from Portugal and unemployment rate among women with children under the age of 6 in the United States with a correlation coefficient (R) of 0.148 and weighted average of 8.3%. Similarly, the statistical analysis conducted on geographies consisting of 254,495,229 people shows a significant positive correlation between the proportion of Immigrants from Thailand and unemployment rate among women with children under the age of 6 in the United States with a correlation coefficient (R) of 0.696 and weighted average of 7.7%, a difference of 7.6%.
Unemployment Among Women with Children Under 6 years Correlation Summary
| Measurement | Immigrants from Portugal | Immigrants from Thailand |
| Minimum | 1.2% | 1.1% |
| Maximum | 31.0% | 100.0% |
| Range | 29.8% | 98.9% |
| Mean | 9.0% | 14.8% |
| Median | 7.5% | 10.0% |
| Interquartile 25% (IQ1) | 4.1% | 7.2% |
| Interquartile 75% (IQ3) | 11.8% | 14.7% |
| Interquartile Range (IQR) | 7.7% | 7.5% |
| Standard Deviation (Sample) | 6.3% | 16.9% |
| Standard Deviation (Population) | 6.2% | 16.7% |
Similar Demographics by Unemployment Among Women with Children Under 6 years
Demographics Similar to Immigrants from Portugal by Unemployment Among Women with Children Under 6 years
In terms of unemployment among women with children under 6 years, the demographic groups most similar to Immigrants from Portugal are Celtic (8.3%, a difference of 0.020%), British West Indian (8.3%, a difference of 0.27%), Immigrants from Caribbean (8.3%, a difference of 0.29%), Immigrants from Ghana (8.3%, a difference of 0.30%), and Immigrants from Guyana (8.2%, a difference of 0.56%).
| Demographics | Rating | Rank | Unemployment Among Women with Children Under 6 years |
| Immigrants | Western Africa | 1.1 /100 | #248 | Tragic 8.2% |
| Immigrants | Sierra Leone | 1.1 /100 | #249 | Tragic 8.2% |
| Nigerians | 1.1 /100 | #250 | Tragic 8.2% |
| Guyanese | 1.0 /100 | #251 | Tragic 8.2% |
| Ghanaians | 1.0 /100 | #252 | Tragic 8.2% |
| Immigrants | Guyana | 0.8 /100 | #253 | Tragic 8.2% |
| Immigrants | Caribbean | 0.7 /100 | #254 | Tragic 8.3% |
| Immigrants | Portugal | 0.6 /100 | #255 | Tragic 8.3% |
| Celtics | 0.6 /100 | #256 | Tragic 8.3% |
| British West Indians | 0.5 /100 | #257 | Tragic 8.3% |
| Immigrants | Ghana | 0.5 /100 | #258 | Tragic 8.3% |
| Barbadians | 0.4 /100 | #259 | Tragic 8.3% |
| Whites/Caucasians | 0.3 /100 | #260 | Tragic 8.4% |
| Immigrants | Liberia | 0.3 /100 | #261 | Tragic 8.4% |
| West Indians | 0.3 /100 | #262 | Tragic 8.4% |
Demographics Similar to Immigrants from Thailand by Unemployment Among Women with Children Under 6 years
In terms of unemployment among women with children under 6 years, the demographic groups most similar to Immigrants from Thailand are Czechoslovakian (7.7%, a difference of 0.010%), Yugoslavian (7.7%, a difference of 0.060%), Spanish American (7.7%, a difference of 0.080%), Indonesian (7.7%, a difference of 0.14%), and Immigrants from Panama (7.7%, a difference of 0.20%).
| Demographics | Rating | Rank | Unemployment Among Women with Children Under 6 years |
| Immigrants | Uruguay | 44.5 /100 | #180 | Average 7.7% |
| Brazilians | 43.9 /100 | #181 | Average 7.7% |
| Nepalese | 43.5 /100 | #182 | Average 7.7% |
| Sierra Leoneans | 42.9 /100 | #183 | Average 7.7% |
| Indonesians | 40.5 /100 | #184 | Average 7.7% |
| Spanish Americans | 39.7 /100 | #185 | Fair 7.7% |
| Yugoslavians | 39.4 /100 | #186 | Fair 7.7% |
| Immigrants | Thailand | 38.5 /100 | #187 | Fair 7.7% |
| Czechoslovakians | 38.4 /100 | #188 | Fair 7.7% |
| Immigrants | Panama | 35.7 /100 | #189 | Fair 7.7% |
| Immigrants | North Macedonia | 34.4 /100 | #190 | Fair 7.7% |
| Immigrants | Austria | 32.4 /100 | #191 | Fair 7.7% |
| Immigrants | Africa | 32.4 /100 | #192 | Fair 7.7% |
| Slavs | 32.4 /100 | #193 | Fair 7.7% |
| Syrians | 31.9 /100 | #194 | Fair 7.7% |