Immigrants from Panama vs Immigrants from Middle Africa Unemployment
COMPARE
Immigrants from Panama
Immigrants from Middle Africa
Unemployment
Unemployment Comparison
Immigrants from Panama
Immigrants from Middle Africa
5.5%
UNEMPLOYMENT
3.4/ 100
METRIC RATING
235th/ 347
METRIC RANK
5.4%
UNEMPLOYMENT
15.3/ 100
METRIC RATING
213th/ 347
METRIC RANK
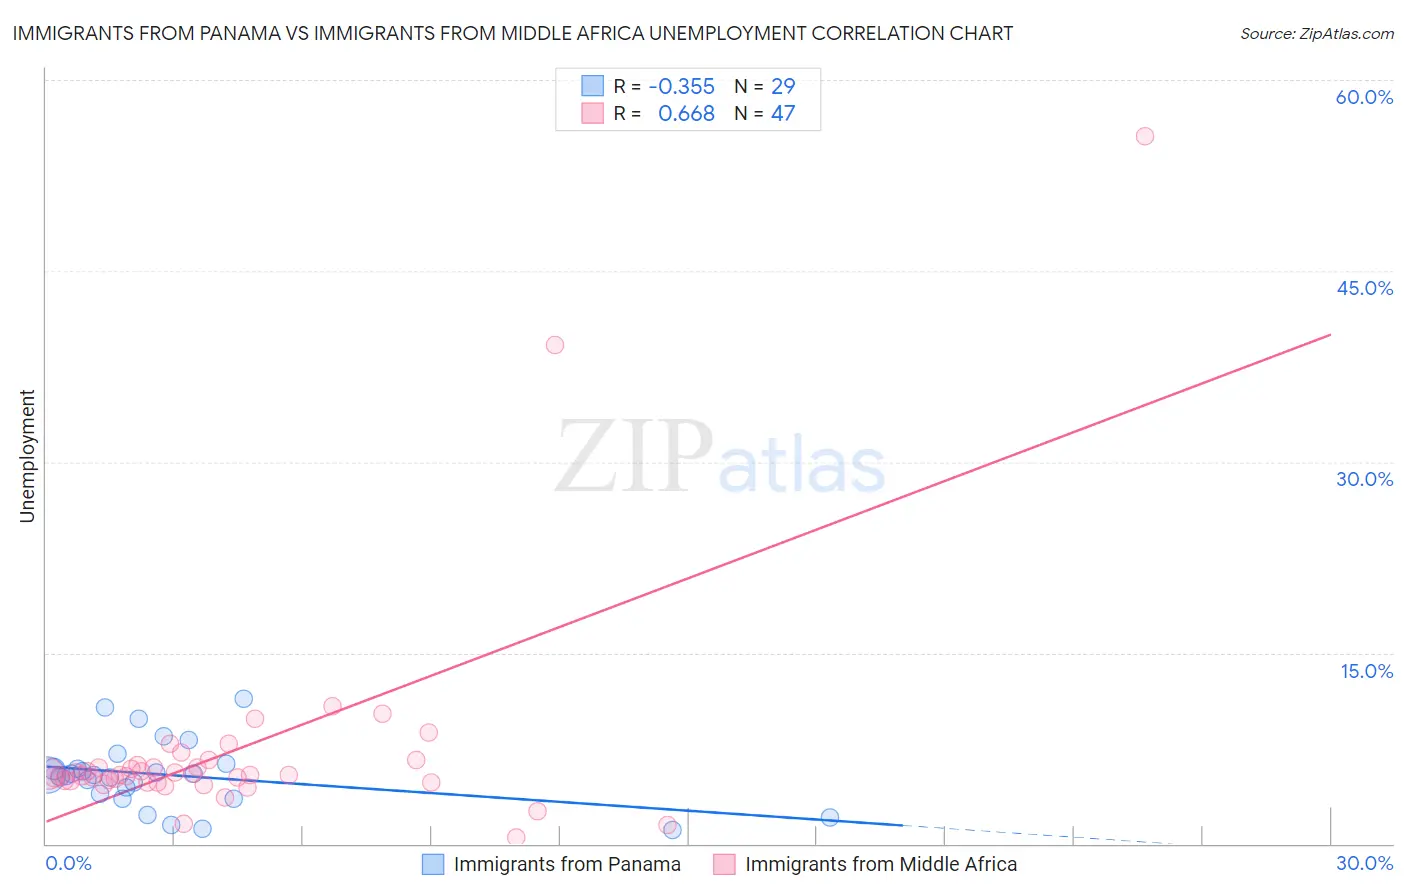
Immigrants from Panama vs Immigrants from Middle Africa Unemployment Correlation Chart
The statistical analysis conducted on geographies consisting of 221,138,228 people shows a mild negative correlation between the proportion of Immigrants from Panama and unemployment in the United States with a correlation coefficient (R) of -0.355 and weighted average of 5.5%. Similarly, the statistical analysis conducted on geographies consisting of 202,675,863 people shows a significant positive correlation between the proportion of Immigrants from Middle Africa and unemployment in the United States with a correlation coefficient (R) of 0.668 and weighted average of 5.4%, a difference of 2.5%.
Unemployment Correlation Summary
| Measurement | Immigrants from Panama | Immigrants from Middle Africa |
| Minimum | 1.1% | 0.50% |
| Maximum | 11.4% | 55.6% |
| Range | 10.3% | 55.1% |
| Mean | 5.4% | 7.3% |
| Median | 5.4% | 5.4% |
| Interquartile 25% (IQ1) | 3.7% | 4.8% |
| Interquartile 75% (IQ3) | 6.1% | 6.1% |
| Interquartile Range (IQR) | 2.4% | 1.3% |
| Standard Deviation (Sample) | 2.6% | 8.9% |
| Standard Deviation (Population) | 2.5% | 8.8% |
Similar Demographics by Unemployment
Demographics Similar to Immigrants from Panama by Unemployment
In terms of unemployment, the demographic groups most similar to Immigrants from Panama are Immigrants from Cambodia (5.5%, a difference of 0.030%), Moroccan (5.5%, a difference of 0.090%), Immigrants from Western Asia (5.5%, a difference of 0.30%), Immigrants (5.5%, a difference of 0.39%), and Cree (5.6%, a difference of 0.40%).
| Demographics | Rating | Rank | Unemployment |
| Guamanians/Chamorros | 6.3 /100 | #228 | Tragic 5.5% |
| Hawaiians | 5.4 /100 | #229 | Tragic 5.5% |
| Ottawa | 5.4 /100 | #230 | Tragic 5.5% |
| Immigrants | Africa | 4.9 /100 | #231 | Tragic 5.5% |
| Comanche | 4.9 /100 | #232 | Tragic 5.5% |
| Immigrants | Syria | 4.8 /100 | #233 | Tragic 5.5% |
| Panamanians | 4.7 /100 | #234 | Tragic 5.5% |
| Immigrants | Panama | 3.4 /100 | #235 | Tragic 5.5% |
| Immigrants | Cambodia | 3.3 /100 | #236 | Tragic 5.5% |
| Moroccans | 3.2 /100 | #237 | Tragic 5.5% |
| Immigrants | Western Asia | 2.8 /100 | #238 | Tragic 5.5% |
| Immigrants | Immigrants | 2.6 /100 | #239 | Tragic 5.5% |
| Cree | 2.6 /100 | #240 | Tragic 5.6% |
| Tlingit-Haida | 2.0 /100 | #241 | Tragic 5.6% |
| Spanish Americans | 2.0 /100 | #242 | Tragic 5.6% |
Demographics Similar to Immigrants from Middle Africa by Unemployment
In terms of unemployment, the demographic groups most similar to Immigrants from Middle Africa are Immigrants from Costa Rica (5.4%, a difference of 0.0%), Delaware (5.4%, a difference of 0.060%), Immigrants from South America (5.4%, a difference of 0.22%), Immigrants from Albania (5.4%, a difference of 0.22%), and Ugandan (5.4%, a difference of 0.29%).
| Demographics | Rating | Rank | Unemployment |
| Immigrants | Peru | 22.7 /100 | #206 | Fair 5.4% |
| Creek | 19.4 /100 | #207 | Poor 5.4% |
| Portuguese | 19.0 /100 | #208 | Poor 5.4% |
| Immigrants | Iran | 18.8 /100 | #209 | Poor 5.4% |
| Immigrants | Iraq | 18.6 /100 | #210 | Poor 5.4% |
| Iraqis | 18.1 /100 | #211 | Poor 5.4% |
| Ugandans | 18.0 /100 | #212 | Poor 5.4% |
| Immigrants | Middle Africa | 15.3 /100 | #213 | Poor 5.4% |
| Immigrants | Costa Rica | 15.2 /100 | #214 | Poor 5.4% |
| Delaware | 14.7 /100 | #215 | Poor 5.4% |
| Immigrants | South America | 13.5 /100 | #216 | Poor 5.4% |
| Immigrants | Albania | 13.5 /100 | #217 | Poor 5.4% |
| Choctaw | 12.7 /100 | #218 | Poor 5.4% |
| Bangladeshis | 11.2 /100 | #219 | Poor 5.4% |
| Soviet Union | 10.6 /100 | #220 | Poor 5.4% |