Immigrants from Pakistan vs Immigrants from Liberia Unemployment Among Seniors over 65 years
COMPARE
Immigrants from Pakistan
Immigrants from Liberia
Unemployment Among Seniors over 65 years
Unemployment Among Seniors over 65 years Comparison
Immigrants from Pakistan
Immigrants from Liberia
5.2%
UNEMPLOYMENT AMONG SENIORS OVER 65 YEARS
18.4/ 100
METRIC RATING
200th/ 347
METRIC RANK
5.5%
UNEMPLOYMENT AMONG SENIORS OVER 65 YEARS
0.0/ 100
METRIC RATING
284th/ 347
METRIC RANK
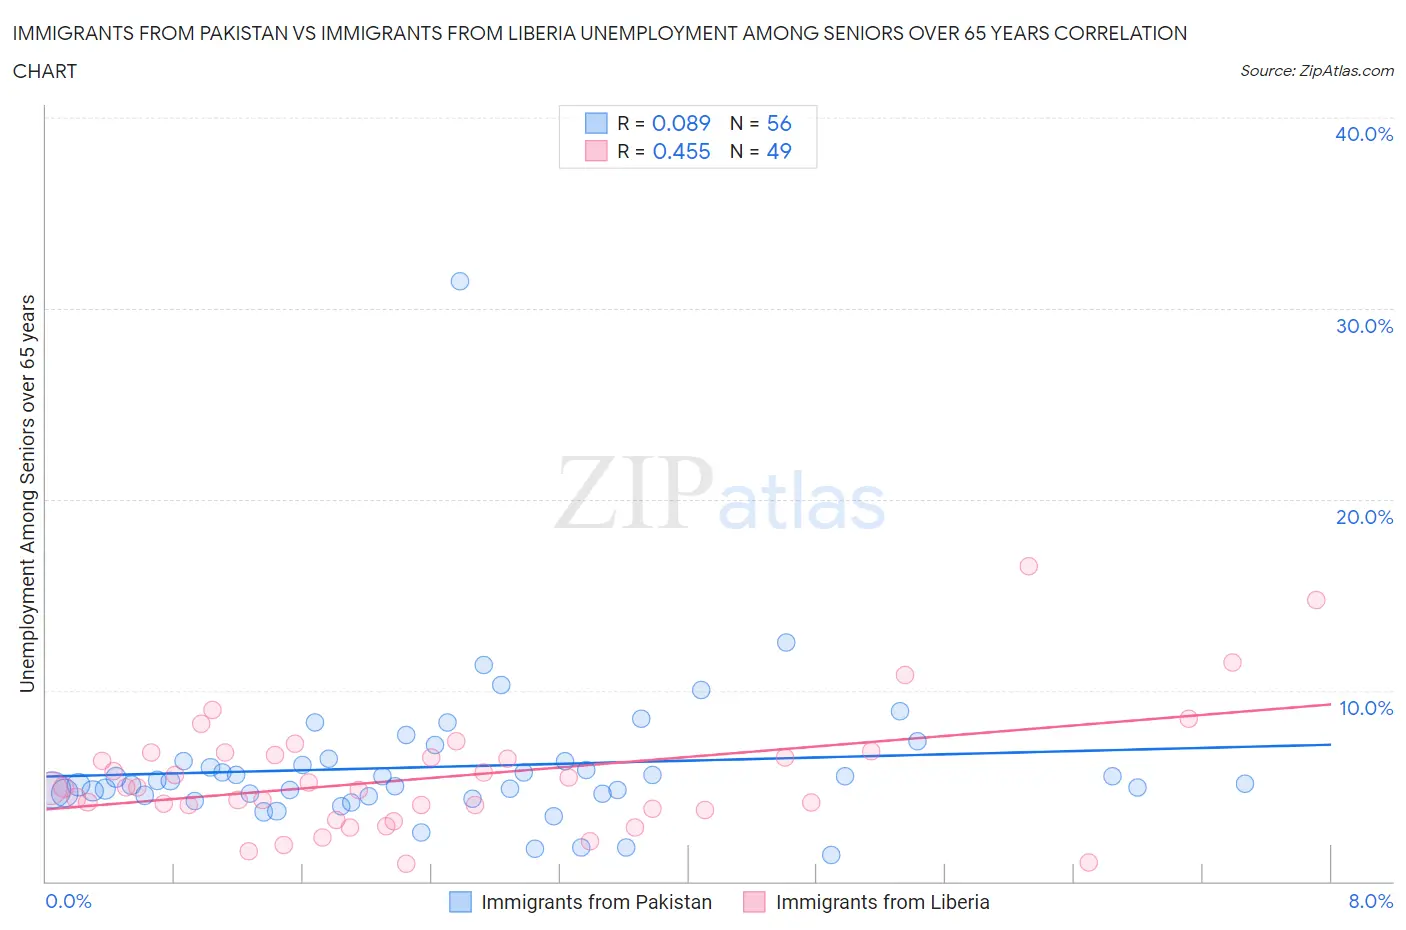
Immigrants from Pakistan vs Immigrants from Liberia Unemployment Among Seniors over 65 years Correlation Chart
The statistical analysis conducted on geographies consisting of 266,310,270 people shows a slight positive correlation between the proportion of Immigrants from Pakistan and unemployment rate amomg seniors over the age of 65 in the United States with a correlation coefficient (R) of 0.089 and weighted average of 5.2%. Similarly, the statistical analysis conducted on geographies consisting of 129,860,705 people shows a moderate positive correlation between the proportion of Immigrants from Liberia and unemployment rate amomg seniors over the age of 65 in the United States with a correlation coefficient (R) of 0.455 and weighted average of 5.5%, a difference of 5.5%.
Unemployment Among Seniors over 65 years Correlation Summary
| Measurement | Immigrants from Pakistan | Immigrants from Liberia |
| Minimum | 1.4% | 0.90% |
| Maximum | 31.4% | 16.5% |
| Range | 30.0% | 15.6% |
| Mean | 6.0% | 5.5% |
| Median | 5.2% | 4.9% |
| Interquartile 25% (IQ1) | 4.5% | 3.7% |
| Interquartile 75% (IQ3) | 6.3% | 6.7% |
| Interquartile Range (IQR) | 1.8% | 2.9% |
| Standard Deviation (Sample) | 4.1% | 3.1% |
| Standard Deviation (Population) | 4.1% | 3.1% |
Similar Demographics by Unemployment Among Seniors over 65 years
Demographics Similar to Immigrants from Pakistan by Unemployment Among Seniors over 65 years
In terms of unemployment among seniors over 65 years, the demographic groups most similar to Immigrants from Pakistan are Laotian (5.2%, a difference of 0.020%), Immigrants from Europe (5.2%, a difference of 0.030%), Immigrants from Northern Africa (5.2%, a difference of 0.040%), Maltese (5.2%, a difference of 0.060%), and Subsaharan African (5.2%, a difference of 0.070%).
| Demographics | Rating | Rank | Unemployment Among Seniors over 65 years |
| Immigrants | Africa | 29.6 /100 | #193 | Fair 5.2% |
| Argentineans | 29.1 /100 | #194 | Fair 5.2% |
| Costa Ricans | 27.0 /100 | #195 | Fair 5.2% |
| Immigrants | Poland | 24.3 /100 | #196 | Fair 5.2% |
| Guamanians/Chamorros | 22.5 /100 | #197 | Fair 5.2% |
| Maltese | 19.6 /100 | #198 | Poor 5.2% |
| Immigrants | Europe | 19.0 /100 | #199 | Poor 5.2% |
| Immigrants | Pakistan | 18.4 /100 | #200 | Poor 5.2% |
| Laotians | 18.1 /100 | #201 | Poor 5.2% |
| Immigrants | Northern Africa | 17.7 /100 | #202 | Poor 5.2% |
| Sub-Saharan Africans | 17.1 /100 | #203 | Poor 5.2% |
| Immigrants | China | 16.9 /100 | #204 | Poor 5.2% |
| South American Indians | 15.3 /100 | #205 | Poor 5.2% |
| German Russians | 14.7 /100 | #206 | Poor 5.2% |
| Immigrants | Philippines | 13.2 /100 | #207 | Poor 5.2% |
Demographics Similar to Immigrants from Liberia by Unemployment Among Seniors over 65 years
In terms of unemployment among seniors over 65 years, the demographic groups most similar to Immigrants from Liberia are Central American (5.5%, a difference of 0.060%), Immigrants from Barbados (5.5%, a difference of 0.080%), Venezuelan (5.5%, a difference of 0.11%), U.S. Virgin Islander (5.5%, a difference of 0.11%), and Immigrants from Cabo Verde (5.5%, a difference of 0.14%).
| Demographics | Rating | Rank | Unemployment Among Seniors over 65 years |
| Immigrants | Western Africa | 0.1 /100 | #277 | Tragic 5.4% |
| Colville | 0.1 /100 | #278 | Tragic 5.4% |
| Brazilians | 0.1 /100 | #279 | Tragic 5.5% |
| Immigrants | South America | 0.1 /100 | #280 | Tragic 5.5% |
| Immigrants | Norway | 0.0 /100 | #281 | Tragic 5.5% |
| Immigrants | Belize | 0.0 /100 | #282 | Tragic 5.5% |
| Immigrants | Haiti | 0.0 /100 | #283 | Tragic 5.5% |
| Immigrants | Liberia | 0.0 /100 | #284 | Tragic 5.5% |
| Central Americans | 0.0 /100 | #285 | Tragic 5.5% |
| Immigrants | Barbados | 0.0 /100 | #286 | Tragic 5.5% |
| Venezuelans | 0.0 /100 | #287 | Tragic 5.5% |
| U.S. Virgin Islanders | 0.0 /100 | #288 | Tragic 5.5% |
| Immigrants | Cabo Verde | 0.0 /100 | #289 | Tragic 5.5% |
| Jamaicans | 0.0 /100 | #290 | Tragic 5.5% |
| Blacks/African Americans | 0.0 /100 | #291 | Tragic 5.5% |