Immigrants from Oceania vs Tlingit-Haida Unemployment Among Seniors over 65 years

COMPARE

Immigrants from Oceania
Race
Ancestry
AfghanAfricanAlaska NativeAlaskan AthabascanAlbanianAleutAlsatianAmericanApacheArabArapahoArgentineanArmenianAssyrian/Chaldean/SyriacAustralianAustrianBahamianBangladeshiBarbadianBasqueBelgianBelizeanBermudanBhutaneseBlackfeetBolivianBrazilianBritishBritish West IndianBulgarianBurmeseCajunCambodianCanadianCape VerdeanCarpatho RusynCelticCentral AmericanCentral American IndianCherokeeCheyenneChickasawChileanChineseChippewaChoctawColombianColvilleComancheCosta RicanCreeCreekCroatianCrowCubanCypriotCzechCzechoslovakianDanishDelawareDominicanDutchDutch West IndianEastern EuropeanEcuadorianEgyptianEnglishEstonianEthiopianEuropeanFijianFilipinoFinnishFrenchFrench American IndianFrench CanadianGermanGerman RussianGhanaianGreekGuamanian/ChamorroGuatemalanGuyaneseHaitianHmongHonduranHopiHoumaHungarianIcelanderIndian (Asian)IndonesianInupiatIranianIraqiIrishIroquoisIsraeliItalianJamaicanJapaneseJordanianKenyanKiowaKoreanLaotianLatvianLebaneseLiberianLithuanianLumbeeLuxembourgerMacedonianMalaysianMalteseMarshalleseMenomineeMexicanMexican American IndianMongolianMoroccanNative HawaiianNavajoNepaleseNew ZealanderNicaraguanNigerianNorthern EuropeanNorwegianOkinawanOsageOttawaPaiutePakistaniPalestinianPanamanianParaguayanPennsylvania GermanPeruvianPimaPolishPortuguesePotawatomiPuebloPuerto RicanPuget Sound SalishRomanianRussianSalvadoranSamoanScandinavianScotch-IrishScottishSeminoleSenegaleseSerbianShoshoneSierra LeoneanSiouxSlavicSlovakSloveneSomaliSouth AfricanSouth AmericanSouth American IndianSoviet UnionSpaniardSpanishSpanish AmericanSpanish American IndianSri LankanSubsaharan AfricanSudaneseSwedishSwissSyrianTaiwaneseThaiTohono O'OdhamTonganTrinidadian and TobagonianTsimshianTurkishU.S. Virgin IslanderUgandanUkrainianUruguayanUteVenezuelanVietnameseWelshWest IndianYakamaYaquiYugoslavianYumanYup'ikZimbabwean
Immigration
NonimmigrantsImmigrantsAfghanistanAfricaAlbaniaArgentinaArmeniaAsiaAustraliaAustriaBahamasBangladeshBarbadosBelarusBelgiumBelizeBoliviaBosnia and HerzegovinaBrazilBulgariaBurma/MyanmarCabo VerdeCambodiaCameroonCanadaCaribbeanCentral AmericaChileChinaColombiaCongoCosta RicaCroatiaCubaCzechoslovakiaDenmarkDominicaDominican RepublicEastern AfricaEastern AsiaEastern EuropeEcuadorEgyptEl SalvadorEnglandEritreaEthiopiaEuropeFijiFranceGermanyGhanaGreeceGrenadaGuatemalaGuyanaHaitiHondurasHong KongHungaryIndiaIndonesiaIranIraqIrelandIsraelItalyJamaicaJapanJordanKazakhstanKenyaKoreaKuwaitLaosLatin AmericaLatviaLebanonLiberiaLithuaniaMalaysiaMexicoMicronesiaMiddle AfricaMoldovaMoroccoNepalNetherlandsNicaraguaNigeriaNorth AmericaNorth MacedoniaNorthern AfricaNorthern EuropeNorwayOceaniaPakistanPanamaPeruPhilippinesPolandPortugalRomaniaRussiaSaudi ArabiaScotlandSenegalSerbiaSierra LeoneSingaporeSomaliaSouth AfricaSouth AmericaSouth Central AsiaSouth Eastern AsiaSouthern EuropeSpainSri LankaSt. Vincent and the GrenadinesSudanSwedenSwitzerlandSyriaTaiwanThailandTrinidad and TobagoTurkeyUgandaUkraineUruguayUzbekistanVenezuelaVietnamWest IndiesWestern AfricaWestern AsiaWestern EuropeYemenZaireZimbabweAzores
Tlingit-Haida
Race
Ancestry
AfghanAfricanAlaska NativeAlaskan AthabascanAlbanianAleutAlsatianAmericanApacheArabArapahoArgentineanArmenianAssyrian/Chaldean/SyriacAustralianAustrianBahamianBangladeshiBarbadianBasqueBelgianBelizeanBermudanBhutaneseBlackfeetBolivianBrazilianBritishBritish West IndianBulgarianBurmeseCajunCambodianCanadianCape VerdeanCarpatho RusynCelticCentral AmericanCentral American IndianCherokeeCheyenneChickasawChileanChineseChippewaChoctawColombianColvilleComancheCosta RicanCreeCreekCroatianCrowCubanCypriotCzechCzechoslovakianDanishDelawareDominicanDutchDutch West IndianEastern EuropeanEcuadorianEgyptianEnglishEstonianEthiopianEuropeanFijianFilipinoFinnishFrenchFrench American IndianFrench CanadianGermanGerman RussianGhanaianGreekGuamanian/ChamorroGuatemalanGuyaneseHaitianHmongHonduranHopiHoumaHungarianIcelanderIndian (Asian)IndonesianInupiatIranianIraqiIrishIroquoisIsraeliItalianJamaicanJapaneseJordanianKenyanKiowaKoreanLaotianLatvianLebaneseLiberianLithuanianLumbeeLuxembourgerMacedonianMalaysianMalteseMarshalleseMenomineeMexicanMexican American IndianMongolianMoroccanNative HawaiianNavajoNepaleseNew ZealanderNicaraguanNigerianNorthern EuropeanNorwegianOkinawanOsageOttawaPaiutePakistaniPalestinianPanamanianParaguayanPennsylvania GermanPeruvianPimaPolishPortuguesePotawatomiPuebloPuerto RicanPuget Sound SalishRomanianRussianSalvadoranSamoanScandinavianScotch-IrishScottishSeminoleSenegaleseSerbianShoshoneSierra LeoneanSiouxSlavicSlovakSloveneSomaliSouth AfricanSouth AmericanSouth American IndianSoviet UnionSpaniardSpanishSpanish AmericanSpanish American IndianSri LankanSubsaharan AfricanSudaneseSwedishSwissSyrianTaiwaneseThaiTlingit-HaidaTohono O'OdhamTonganTrinidadian and TobagonianTsimshianTurkishU.S. Virgin IslanderUgandanUkrainianUruguayanUteVenezuelanVietnameseWelshWest IndianYakamaYaquiYugoslavianYumanYup'ikZimbabwean
Immigration
NonimmigrantsImmigrantsAfghanistanAfricaAlbaniaArgentinaArmeniaAsiaAustraliaAustriaBahamasBangladeshBarbadosBelarusBelgiumBelizeBoliviaBosnia and HerzegovinaBrazilBulgariaBurma/MyanmarCabo VerdeCambodiaCameroonCanadaCaribbeanCentral AmericaChileChinaColombiaCongoCosta RicaCroatiaCubaCzechoslovakiaDenmarkDominicaDominican RepublicEastern AfricaEastern AsiaEastern EuropeEcuadorEgyptEl SalvadorEnglandEritreaEthiopiaEuropeFijiFranceGermanyGhanaGreeceGrenadaGuatemalaGuyanaHaitiHondurasHong KongHungaryIndiaIndonesiaIranIraqIrelandIsraelItalyJamaicaJapanJordanKazakhstanKenyaKoreaKuwaitLaosLatin AmericaLatviaLebanonLiberiaLithuaniaMalaysiaMexicoMicronesiaMiddle AfricaMoldovaMoroccoNepalNetherlandsNicaraguaNigeriaNorth AmericaNorth MacedoniaNorthern AfricaNorthern EuropeNorwayPakistanPanamaPeruPhilippinesPolandPortugalRomaniaRussiaSaudi ArabiaScotlandSenegalSerbiaSierra LeoneSingaporeSomaliaSouth AfricaSouth AmericaSouth Central AsiaSouth Eastern AsiaSouthern EuropeSpainSri LankaSt. Vincent and the GrenadinesSudanSwedenSwitzerlandSyriaTaiwanThailandTrinidad and TobagoTurkeyUgandaUkraineUruguayUzbekistanVenezuelaVietnamWest IndiesWestern AfricaWestern AsiaWestern EuropeYemenZaireZimbabweAzores
Unemployment Among Seniors over 65 years
Income
Poverty
Unemployment
Labor Participation
Family Structure
Vehicle Availability
Education Level
Disability

Unemployment Among Seniors over 65 years Comparison

Immigrants from Oceania

Tlingit-Haida

Exceptional
Tragic
5.0%
UNEMPLOYMENT AMONG SENIORS OVER 65 YEARS
96.8/ 100
METRIC RATING
97th/ 347
METRIC RANK
6.8%
UNEMPLOYMENT AMONG SENIORS OVER 65 YEARS
0.0/ 100
METRIC RATING
343rd/ 347
METRIC RANK

Immigrants from Oceania vs Tlingit-Haida Unemployment Among Seniors over 65 years Correlation Chart

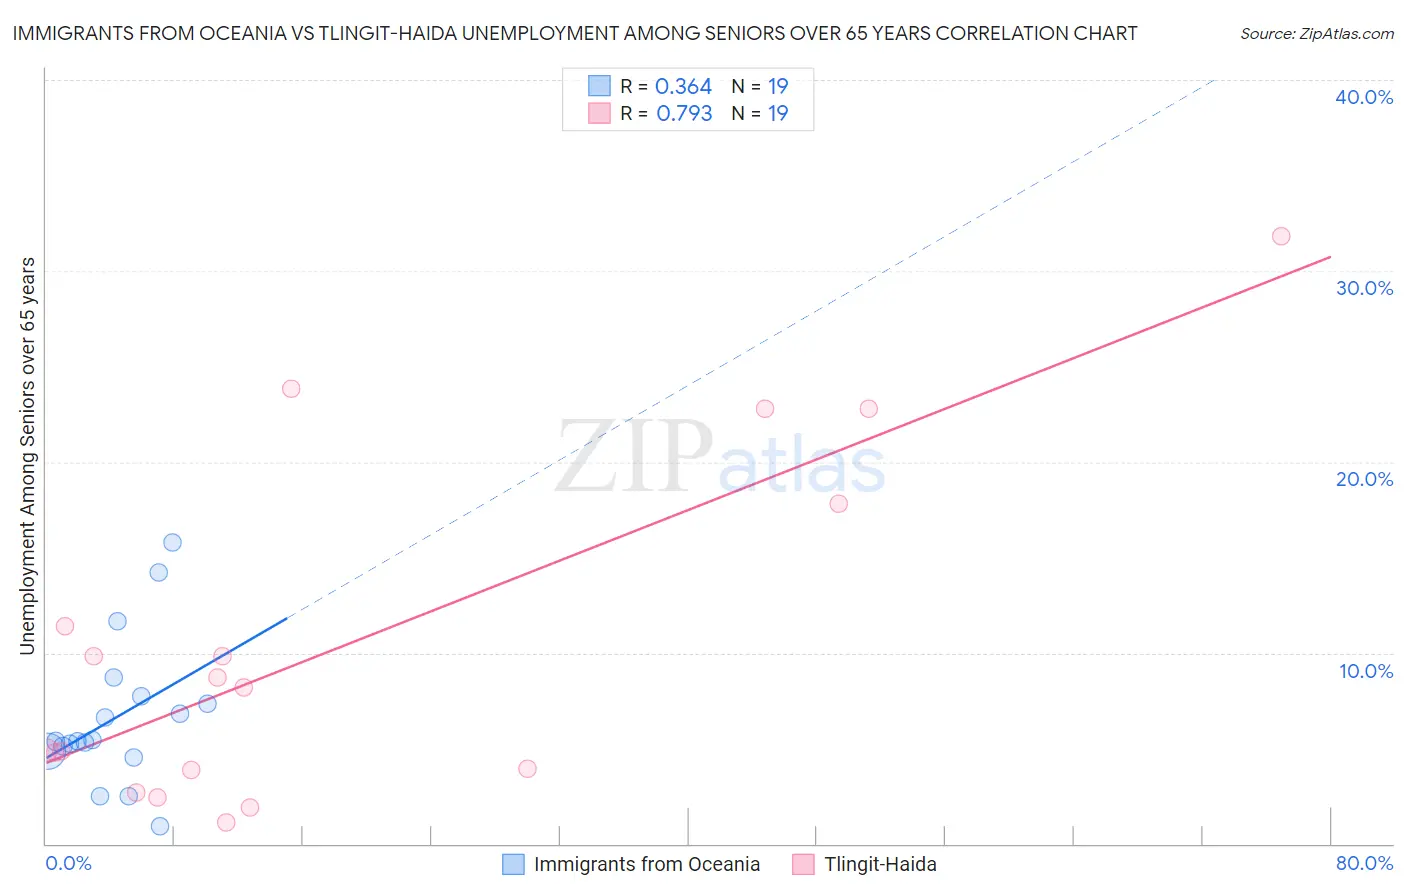
The statistical analysis conducted on geographies consisting of 280,737,896 people shows a mild positive correlation between the proportion of Immigrants from Oceania and unemployment rate amomg seniors over the age of 65 in the United States with a correlation coefficient (R) of 0.364 and weighted average of 5.0%. Similarly, the statistical analysis conducted on geographies consisting of 57,782,692 people shows a strong positive correlation between the proportion of Tlingit-Haida and unemployment rate amomg seniors over the age of 65 in the United States with a correlation coefficient (R) of 0.793 and weighted average of 6.8%, a difference of 35.6%.
Immigrants from Oceania vs Tlingit-Haida Unemployment Among Seniors over 65 years

Unemployment Among Seniors over 65 years Correlation Summary

MeasurementImmigrants from OceaniaTlingit-Haida
Minimum0.94%1.1%
Maximum15.8%31.8%
Range14.9%30.7%
Mean6.6%10.4%
Median5.4%8.2%
Interquartile 25% (IQ1)4.8%3.8%
Interquartile 75% (IQ3)7.7%17.8%
Interquartile Range (IQR)2.9%14.0%
Standard Deviation (Sample)3.8%9.0%
Standard Deviation (Population)3.7%8.8%

Similar Demographics by Unemployment Among Seniors over 65 years

Demographics Similar to Immigrants from Oceania by Unemployment Among Seniors over 65 years

In terms of unemployment among seniors over 65 years, the demographic groups most similar to Immigrants from Oceania are Immigrants from Singapore (5.0%, a difference of 0.0%), Assyrian/Chaldean/Syriac (5.0%, a difference of 0.010%), Czechoslovakian (5.0%, a difference of 0.010%), Burmese (5.0%, a difference of 0.020%), and South African (5.0%, a difference of 0.060%).
DemographicsRating | RankUnemployment Among Seniors over 65 years
Immigrants | South Africa
97.6
/100
|
#90
Exceptional
5.0%
Immigrants | Bolivia
97.3
/100
|
#91
Exceptional
5.0%
Immigrants | Bulgaria
97.3
/100
|
#92
Exceptional
5.0%
Austrians
97.3
/100
|
#93
Exceptional
5.0%
Burmese
96.8
/100
|
#94
Exceptional
5.0%
Assyrians/Chaldeans/Syriacs
96.8
/100
|
#95
Exceptional
5.0%
Immigrants | Singapore
96.8
/100
|
#96
Exceptional
5.0%
Immigrants | Oceania
96.8
/100
|
#97
Exceptional
5.0%
Czechoslovakians
96.7
/100
|
#98
Exceptional
5.0%
South Africans
96.5
/100
|
#99
Exceptional
5.0%
Romanians
95.5
/100
|
#100
Exceptional
5.0%
Yugoslavians
95.4
/100
|
#101
Exceptional
5.0%
Immigrants | Thailand
95.4
/100
|
#102
Exceptional
5.0%
Immigrants | Lithuania
95.1
/100
|
#103
Exceptional
5.0%
Immigrants | Scotland
95.0
/100
|
#104
Exceptional
5.0%

Demographics Similar to Tlingit-Haida by Unemployment Among Seniors over 65 years

In terms of unemployment among seniors over 65 years, the demographic groups most similar to Tlingit-Haida are Navajo (6.7%, a difference of 1.3%), Yakama (6.7%, a difference of 1.8%), Alaskan Athabascan (7.0%, a difference of 3.8%), Ute (6.3%, a difference of 7.2%), and Paiute (6.3%, a difference of 7.3%).
DemographicsRating | RankUnemployment Among Seniors over 65 years
Immigrants | Dominican Republic
0.0
/100
|
#333
Tragic
6.0%
Tohono O'odham
0.0
/100
|
#334
Tragic
6.1%
Immigrants | Armenia
0.0
/100
|
#335
Tragic
6.2%
Pima
0.0
/100
|
#336
Tragic
6.3%
Alaska Natives
0.0
/100
|
#337
Tragic
6.3%
Immigrants | Azores
0.0
/100
|
#338
Tragic
6.3%
Paiute
0.0
/100
|
#339
Tragic
6.3%
Ute
0.0
/100
|
#340
Tragic
6.3%
Yakama
0.0
/100
|
#341
Tragic
6.7%
Navajo
0.0
/100
|
#342
Tragic
6.7%
Tlingit-Haida
0.0
/100
|
#343
Tragic
6.8%
Alaskan Athabascans
0.0
/100
|
#344
Tragic
7.0%
Immigrants | Yemen
0.0
/100
|
#345
Tragic
8.2%
Yup'ik
0.0
/100
|
#346
Tragic
9.1%
Crow
0.0
/100
|
#347
Tragic
16.9%