Immigrants from Norway vs Greek Unemployment Among Ages 16 to 19 years
COMPARE
Immigrants from Norway
Greek
Unemployment Among Ages 16 to 19 years
Unemployment Among Ages 16 to 19 years Comparison
Immigrants from Norway
Greeks
17.5%
UNEMPLOYMENT AMONG AGES 16 TO 19 YEARS
59.8/ 100
METRIC RATING
162nd/ 347
METRIC RANK
16.9%
UNEMPLOYMENT AMONG AGES 16 TO 19 YEARS
97.0/ 100
METRIC RATING
87th/ 347
METRIC RANK
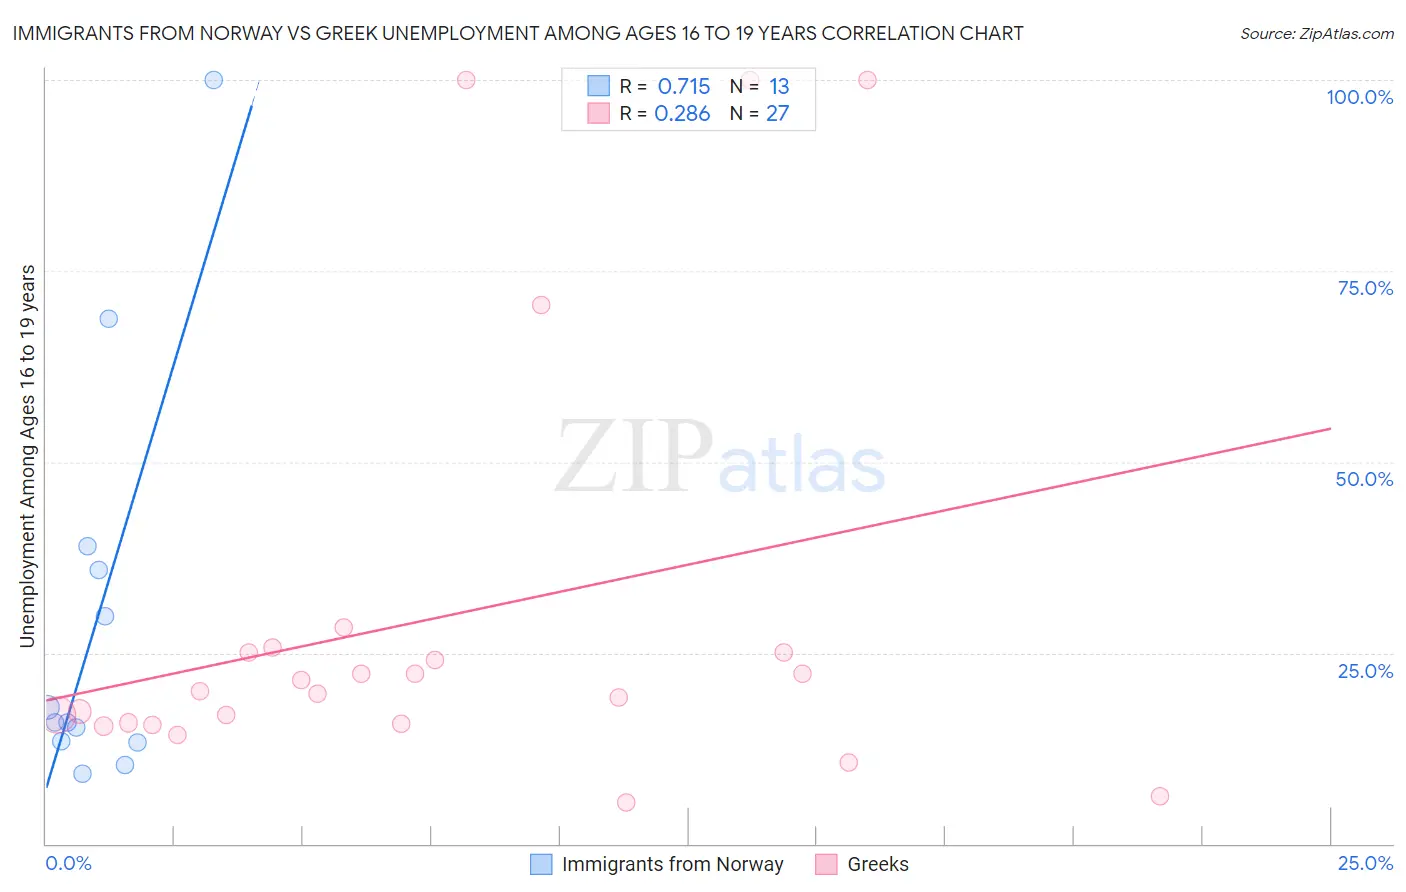
Immigrants from Norway vs Greek Unemployment Among Ages 16 to 19 years Correlation Chart
The statistical analysis conducted on geographies consisting of 113,547,902 people shows a strong positive correlation between the proportion of Immigrants from Norway and unemployment rate among population between the ages 16 and 19 in the United States with a correlation coefficient (R) of 0.715 and weighted average of 17.5%. Similarly, the statistical analysis conducted on geographies consisting of 447,500,260 people shows a weak positive correlation between the proportion of Greeks and unemployment rate among population between the ages 16 and 19 in the United States with a correlation coefficient (R) of 0.286 and weighted average of 16.9%, a difference of 3.8%.
Unemployment Among Ages 16 to 19 years Correlation Summary
| Measurement | Immigrants from Norway | Greek |
| Minimum | 9.2% | 5.5% |
| Maximum | 100.0% | 100.0% |
| Range | 90.8% | 94.5% |
| Mean | 29.6% | 29.5% |
| Median | 15.9% | 19.9% |
| Interquartile 25% (IQ1) | 13.3% | 15.7% |
| Interquartile 75% (IQ3) | 37.4% | 25.1% |
| Interquartile Range (IQR) | 24.1% | 9.4% |
| Standard Deviation (Sample) | 26.9% | 27.8% |
| Standard Deviation (Population) | 25.8% | 27.3% |
Similar Demographics by Unemployment Among Ages 16 to 19 years
Demographics Similar to Immigrants from Norway by Unemployment Among Ages 16 to 19 years
In terms of unemployment among ages 16 to 19 years, the demographic groups most similar to Immigrants from Norway are Egyptian (17.5%, a difference of 0.0%), Immigrants from Denmark (17.5%, a difference of 0.030%), Ukrainian (17.5%, a difference of 0.040%), Korean (17.5%, a difference of 0.060%), and Immigrants from Austria (17.5%, a difference of 0.10%).
| Demographics | Rating | Rank | Unemployment Among Ages 16 to 19 years |
| Portuguese | 67.3 /100 | #155 | Good 17.4% |
| Costa Ricans | 65.9 /100 | #156 | Good 17.4% |
| Uruguayans | 64.3 /100 | #157 | Good 17.5% |
| Immigrants | China | 64.1 /100 | #158 | Good 17.5% |
| Koreans | 61.0 /100 | #159 | Good 17.5% |
| Ukrainians | 60.5 /100 | #160 | Good 17.5% |
| Immigrants | Denmark | 60.3 /100 | #161 | Good 17.5% |
| Immigrants | Norway | 59.8 /100 | #162 | Average 17.5% |
| Egyptians | 59.7 /100 | #163 | Average 17.5% |
| Immigrants | Austria | 57.7 /100 | #164 | Average 17.5% |
| Cape Verdeans | 55.8 /100 | #165 | Average 17.5% |
| Immigrants | Italy | 55.2 /100 | #166 | Average 17.5% |
| Immigrants | France | 54.9 /100 | #167 | Average 17.5% |
| Immigrants | Hungary | 54.7 /100 | #168 | Average 17.5% |
| Immigrants | Cambodia | 54.5 /100 | #169 | Average 17.5% |
Demographics Similar to Greeks by Unemployment Among Ages 16 to 19 years
In terms of unemployment among ages 16 to 19 years, the demographic groups most similar to Greeks are Immigrants from South Africa (16.9%, a difference of 0.060%), Immigrants from Scotland (16.8%, a difference of 0.070%), Immigrants from Kuwait (16.8%, a difference of 0.080%), French (16.8%, a difference of 0.15%), and Canadian (16.9%, a difference of 0.15%).
| Demographics | Rating | Rank | Unemployment Among Ages 16 to 19 years |
| French Canadians | 97.5 /100 | #80 | Exceptional 16.8% |
| Immigrants | Latvia | 97.5 /100 | #81 | Exceptional 16.8% |
| Whites/Caucasians | 97.5 /100 | #82 | Exceptional 16.8% |
| Ugandans | 97.4 /100 | #83 | Exceptional 16.8% |
| French | 97.4 /100 | #84 | Exceptional 16.8% |
| Immigrants | Kuwait | 97.2 /100 | #85 | Exceptional 16.8% |
| Immigrants | Scotland | 97.2 /100 | #86 | Exceptional 16.8% |
| Greeks | 97.0 /100 | #87 | Exceptional 16.9% |
| Immigrants | South Africa | 96.9 /100 | #88 | Exceptional 16.9% |
| Canadians | 96.7 /100 | #89 | Exceptional 16.9% |
| Asians | 96.6 /100 | #90 | Exceptional 16.9% |
| Cambodians | 96.3 /100 | #91 | Exceptional 16.9% |
| South Africans | 95.9 /100 | #92 | Exceptional 16.9% |
| Cubans | 95.8 /100 | #93 | Exceptional 16.9% |
| Bangladeshis | 95.8 /100 | #94 | Exceptional 16.9% |