Immigrants from Northern Europe vs Immigrants from Southern Europe Unemployment Among Ages 55 to 59 years
COMPARE
Immigrants from Northern Europe
Immigrants from Southern Europe
Unemployment Among Ages 55 to 59 years
Unemployment Among Ages 55 to 59 years Comparison
Immigrants from Northern Europe
Immigrants from Southern Europe
4.8%
UNEMPLOYMENT AMONG AGES 55 TO 59 YEARS
77.5/ 100
METRIC RATING
145th/ 347
METRIC RANK
5.0%
UNEMPLOYMENT AMONG AGES 55 TO 59 YEARS
1.8/ 100
METRIC RATING
234th/ 347
METRIC RANK
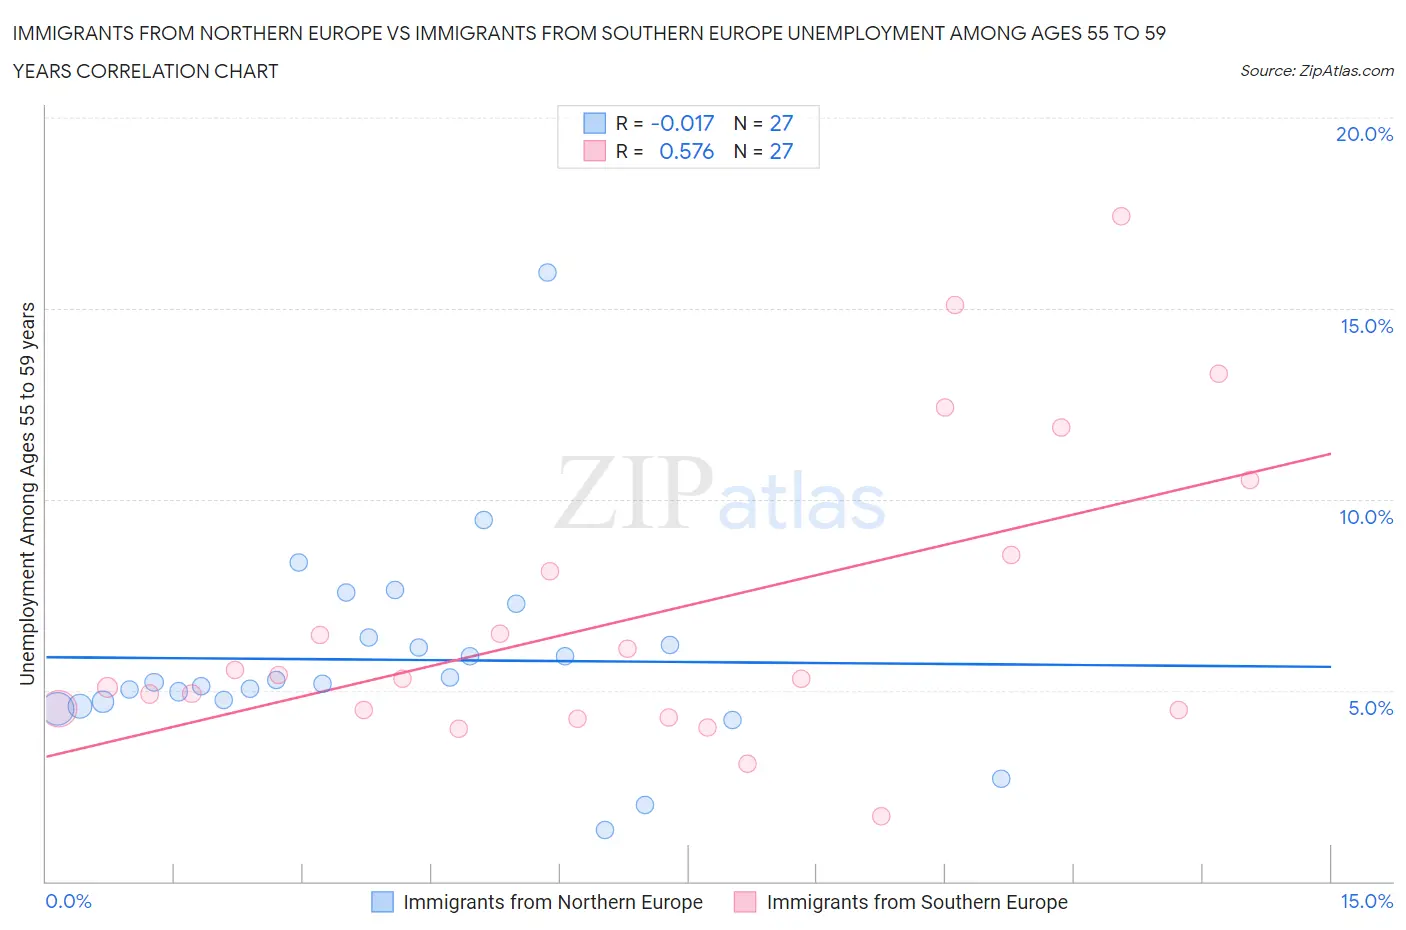
Immigrants from Northern Europe vs Immigrants from Southern Europe Unemployment Among Ages 55 to 59 years Correlation Chart
The statistical analysis conducted on geographies consisting of 432,535,263 people shows no correlation between the proportion of Immigrants from Northern Europe and unemployment rate among population between the ages 55 and 59 in the United States with a correlation coefficient (R) of -0.017 and weighted average of 4.8%. Similarly, the statistical analysis conducted on geographies consisting of 375,573,900 people shows a substantial positive correlation between the proportion of Immigrants from Southern Europe and unemployment rate among population between the ages 55 and 59 in the United States with a correlation coefficient (R) of 0.576 and weighted average of 5.0%, a difference of 5.4%.
Unemployment Among Ages 55 to 59 years Correlation Summary
| Measurement | Immigrants from Northern Europe | Immigrants from Southern Europe |
| Minimum | 1.3% | 1.7% |
| Maximum | 15.9% | 17.4% |
| Range | 14.6% | 15.7% |
| Mean | 5.8% | 6.9% |
| Median | 5.2% | 5.3% |
| Interquartile 25% (IQ1) | 4.7% | 4.5% |
| Interquartile 75% (IQ3) | 6.4% | 8.5% |
| Interquartile Range (IQR) | 1.7% | 4.0% |
| Standard Deviation (Sample) | 2.7% | 3.9% |
| Standard Deviation (Population) | 2.6% | 3.9% |
Similar Demographics by Unemployment Among Ages 55 to 59 years
Demographics Similar to Immigrants from Northern Europe by Unemployment Among Ages 55 to 59 years
In terms of unemployment among ages 55 to 59 years, the demographic groups most similar to Immigrants from Northern Europe are Immigrants from South Eastern Asia (4.8%, a difference of 0.010%), Immigrants from Asia (4.8%, a difference of 0.020%), Ukrainian (4.8%, a difference of 0.060%), Immigrants from Singapore (4.8%, a difference of 0.060%), and Immigrants from Norway (4.8%, a difference of 0.14%).
| Demographics | Rating | Rank | Unemployment Among Ages 55 to 59 years |
| Immigrants | Switzerland | 82.9 /100 | #138 | Excellent 4.7% |
| Romanians | 82.7 /100 | #139 | Excellent 4.7% |
| Immigrants | Indonesia | 80.2 /100 | #140 | Excellent 4.8% |
| French Canadians | 80.1 /100 | #141 | Excellent 4.8% |
| Immigrants | Norway | 79.8 /100 | #142 | Good 4.8% |
| Ukrainians | 78.6 /100 | #143 | Good 4.8% |
| Immigrants | Asia | 77.8 /100 | #144 | Good 4.8% |
| Immigrants | Northern Europe | 77.5 /100 | #145 | Good 4.8% |
| Immigrants | South Eastern Asia | 77.4 /100 | #146 | Good 4.8% |
| Immigrants | Singapore | 76.6 /100 | #147 | Good 4.8% |
| Immigrants | Bahamas | 71.8 /100 | #148 | Good 4.8% |
| Immigrants | Lithuania | 70.8 /100 | #149 | Good 4.8% |
| Immigrants | Northern Africa | 69.8 /100 | #150 | Good 4.8% |
| Bahamians | 68.6 /100 | #151 | Good 4.8% |
| Laotians | 68.2 /100 | #152 | Good 4.8% |
Demographics Similar to Immigrants from Southern Europe by Unemployment Among Ages 55 to 59 years
In terms of unemployment among ages 55 to 59 years, the demographic groups most similar to Immigrants from Southern Europe are Immigrants from Hong Kong (5.0%, a difference of 0.23%), Immigrants (5.0%, a difference of 0.24%), Albanian (5.0%, a difference of 0.32%), Immigrants from Albania (5.0%, a difference of 0.34%), and Choctaw (5.0%, a difference of 0.35%).
| Demographics | Rating | Rank | Unemployment Among Ages 55 to 59 years |
| Immigrants | Iran | 3.7 /100 | #227 | Tragic 5.0% |
| Immigrants | Liberia | 3.2 /100 | #228 | Tragic 5.0% |
| Immigrants | Western Asia | 3.0 /100 | #229 | Tragic 5.0% |
| Immigrants | Syria | 2.7 /100 | #230 | Tragic 5.0% |
| Cherokee | 2.6 /100 | #231 | Tragic 5.0% |
| Albanians | 2.5 /100 | #232 | Tragic 5.0% |
| Immigrants | Immigrants | 2.3 /100 | #233 | Tragic 5.0% |
| Immigrants | Southern Europe | 1.8 /100 | #234 | Tragic 5.0% |
| Immigrants | Hong Kong | 1.4 /100 | #235 | Tragic 5.0% |
| Immigrants | Albania | 1.3 /100 | #236 | Tragic 5.0% |
| Choctaw | 1.3 /100 | #237 | Tragic 5.0% |
| Moroccans | 1.3 /100 | #238 | Tragic 5.0% |
| French American Indians | 1.2 /100 | #239 | Tragic 5.0% |
| Immigrants | Costa Rica | 1.1 /100 | #240 | Tragic 5.0% |
| Brazilians | 1.0 /100 | #241 | Tragic 5.0% |