Immigrants from Northern Africa vs French American Indian Unemployment Among Ages 45 to 54 years
COMPARE
Immigrants from Northern Africa
French American Indian
Unemployment Among Ages 45 to 54 years
Unemployment Among Ages 45 to 54 years Comparison
Immigrants from Northern Africa
French American Indians
4.5%
UNEMPLOYMENT AMONG AGES 45 TO 54 YEARS
49.0/ 100
METRIC RATING
177th/ 347
METRIC RANK
5.0%
UNEMPLOYMENT AMONG AGES 45 TO 54 YEARS
0.0/ 100
METRIC RATING
276th/ 347
METRIC RANK
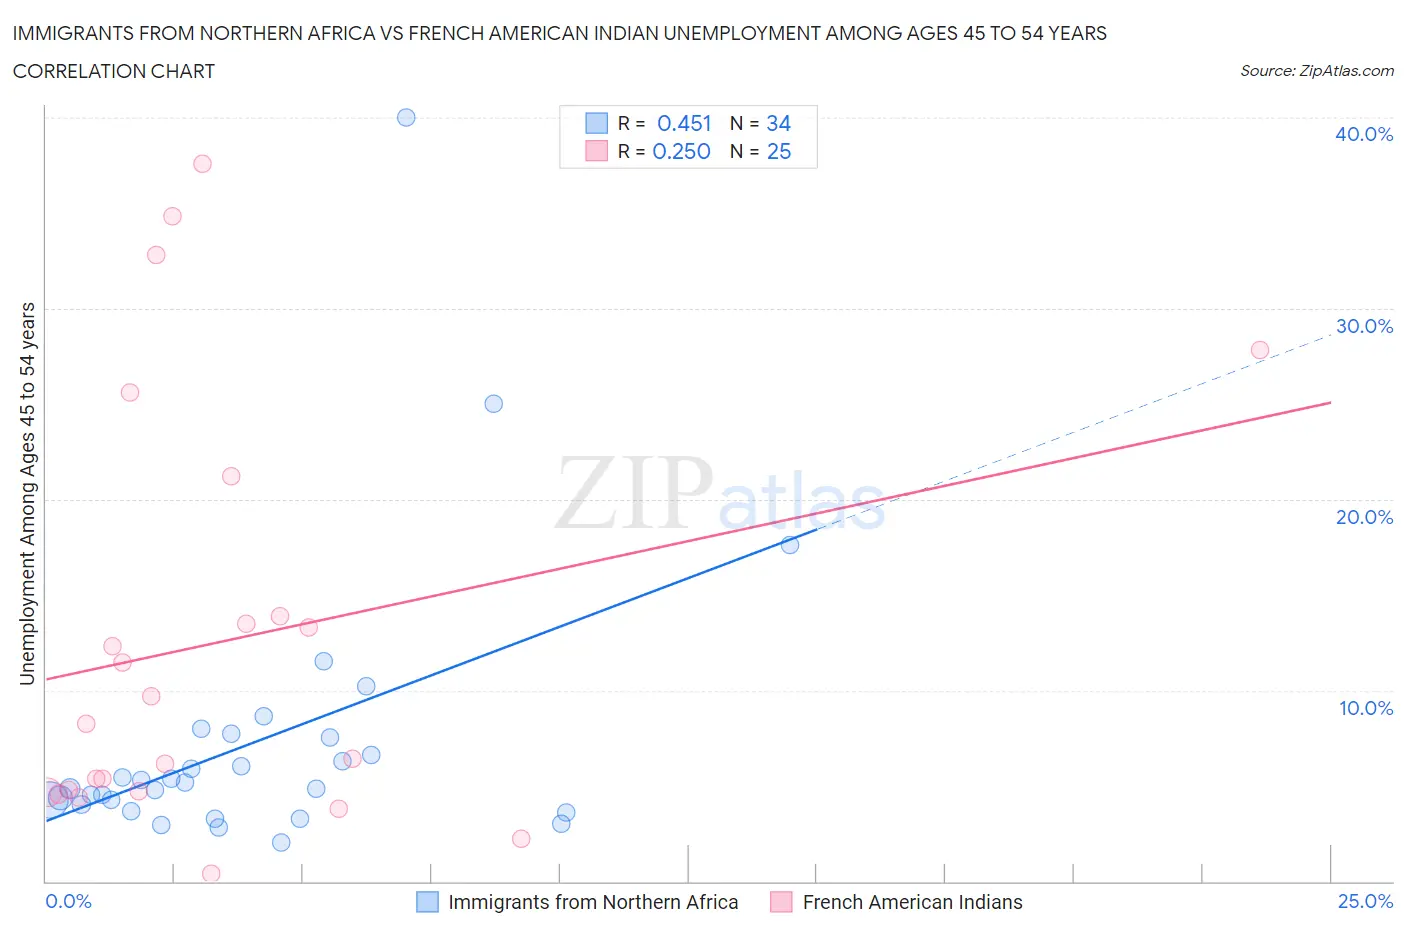
Immigrants from Northern Africa vs French American Indian Unemployment Among Ages 45 to 54 years Correlation Chart
The statistical analysis conducted on geographies consisting of 316,462,246 people shows a moderate positive correlation between the proportion of Immigrants from Northern Africa and unemployment rate among population between the ages 45 and 54 in the United States with a correlation coefficient (R) of 0.451 and weighted average of 4.5%. Similarly, the statistical analysis conducted on geographies consisting of 129,983,277 people shows a weak positive correlation between the proportion of French American Indians and unemployment rate among population between the ages 45 and 54 in the United States with a correlation coefficient (R) of 0.250 and weighted average of 5.0%, a difference of 11.0%.
Unemployment Among Ages 45 to 54 years Correlation Summary
| Measurement | Immigrants from Northern Africa | French American Indian |
| Minimum | 2.0% | 0.40% |
| Maximum | 40.0% | 37.6% |
| Range | 38.0% | 37.2% |
| Mean | 7.3% | 12.6% |
| Median | 5.0% | 8.2% |
| Interquartile 25% (IQ1) | 4.0% | 4.7% |
| Interquartile 75% (IQ3) | 7.5% | 17.5% |
| Interquartile Range (IQR) | 3.5% | 12.9% |
| Standard Deviation (Sample) | 7.3% | 10.9% |
| Standard Deviation (Population) | 7.2% | 10.7% |
Similar Demographics by Unemployment Among Ages 45 to 54 years
Demographics Similar to Immigrants from Northern Africa by Unemployment Among Ages 45 to 54 years
In terms of unemployment among ages 45 to 54 years, the demographic groups most similar to Immigrants from Northern Africa are Puget Sound Salish (4.5%, a difference of 0.0%), Immigrants from France (4.5%, a difference of 0.020%), Immigrants from Australia (4.5%, a difference of 0.020%), Immigrants from Russia (4.5%, a difference of 0.040%), and Immigrants from Hungary (4.5%, a difference of 0.050%).
| Demographics | Rating | Rank | Unemployment Among Ages 45 to 54 years |
| Spaniards | 54.3 /100 | #170 | Average 4.5% |
| Egyptians | 53.6 /100 | #171 | Average 4.5% |
| Colombians | 53.3 /100 | #172 | Average 4.5% |
| Immigrants | Colombia | 52.0 /100 | #173 | Average 4.5% |
| Immigrants | Hungary | 50.0 /100 | #174 | Average 4.5% |
| Immigrants | France | 49.4 /100 | #175 | Average 4.5% |
| Puget Sound Salish | 49.1 /100 | #176 | Average 4.5% |
| Immigrants | Northern Africa | 49.0 /100 | #177 | Average 4.5% |
| Immigrants | Australia | 48.5 /100 | #178 | Average 4.5% |
| Immigrants | Russia | 48.2 /100 | #179 | Average 4.5% |
| Malaysians | 47.5 /100 | #180 | Average 4.5% |
| Immigrants | Poland | 47.0 /100 | #181 | Average 4.5% |
| Immigrants | China | 46.7 /100 | #182 | Average 4.5% |
| Sierra Leoneans | 46.7 /100 | #183 | Average 4.5% |
| Immigrants | Hong Kong | 45.9 /100 | #184 | Average 4.5% |
Demographics Similar to French American Indians by Unemployment Among Ages 45 to 54 years
In terms of unemployment among ages 45 to 54 years, the demographic groups most similar to French American Indians are Immigrants from Mexico (5.0%, a difference of 0.13%), Dutch West Indian (5.0%, a difference of 0.33%), Nepalese (5.0%, a difference of 0.47%), Bermudan (5.0%, a difference of 0.61%), and U.S. Virgin Islander (5.0%, a difference of 0.66%).
| Demographics | Rating | Rank | Unemployment Among Ages 45 to 54 years |
| Somalis | 0.0 /100 | #269 | Tragic 5.0% |
| Immigrants | Ghana | 0.0 /100 | #270 | Tragic 5.0% |
| Cajuns | 0.0 /100 | #271 | Tragic 5.0% |
| Immigrants | Central America | 0.0 /100 | #272 | Tragic 5.0% |
| Immigrants | Latin America | 0.0 /100 | #273 | Tragic 5.0% |
| U.S. Virgin Islanders | 0.0 /100 | #274 | Tragic 5.0% |
| Bermudans | 0.0 /100 | #275 | Tragic 5.0% |
| French American Indians | 0.0 /100 | #276 | Tragic 5.0% |
| Immigrants | Mexico | 0.0 /100 | #277 | Tragic 5.0% |
| Dutch West Indians | 0.0 /100 | #278 | Tragic 5.0% |
| Nepalese | 0.0 /100 | #279 | Tragic 5.0% |
| Blackfeet | 0.0 /100 | #280 | Tragic 5.1% |
| Spanish American Indians | 0.0 /100 | #281 | Tragic 5.1% |
| Africans | 0.0 /100 | #282 | Tragic 5.1% |
| Hispanics or Latinos | 0.0 /100 | #283 | Tragic 5.1% |