Immigrants from North America vs Immigrants from Serbia Female Unemployment
COMPARE
Immigrants from North America
Immigrants from Serbia
Female Unemployment
Female Unemployment Comparison
Immigrants from North America
Immigrants from Serbia
4.9%
FEMALE UNEMPLOYMENT
98.3/ 100
METRIC RATING
65th/ 347
METRIC RANK
5.0%
FEMALE UNEMPLOYMENT
97.2/ 100
METRIC RATING
83rd/ 347
METRIC RANK
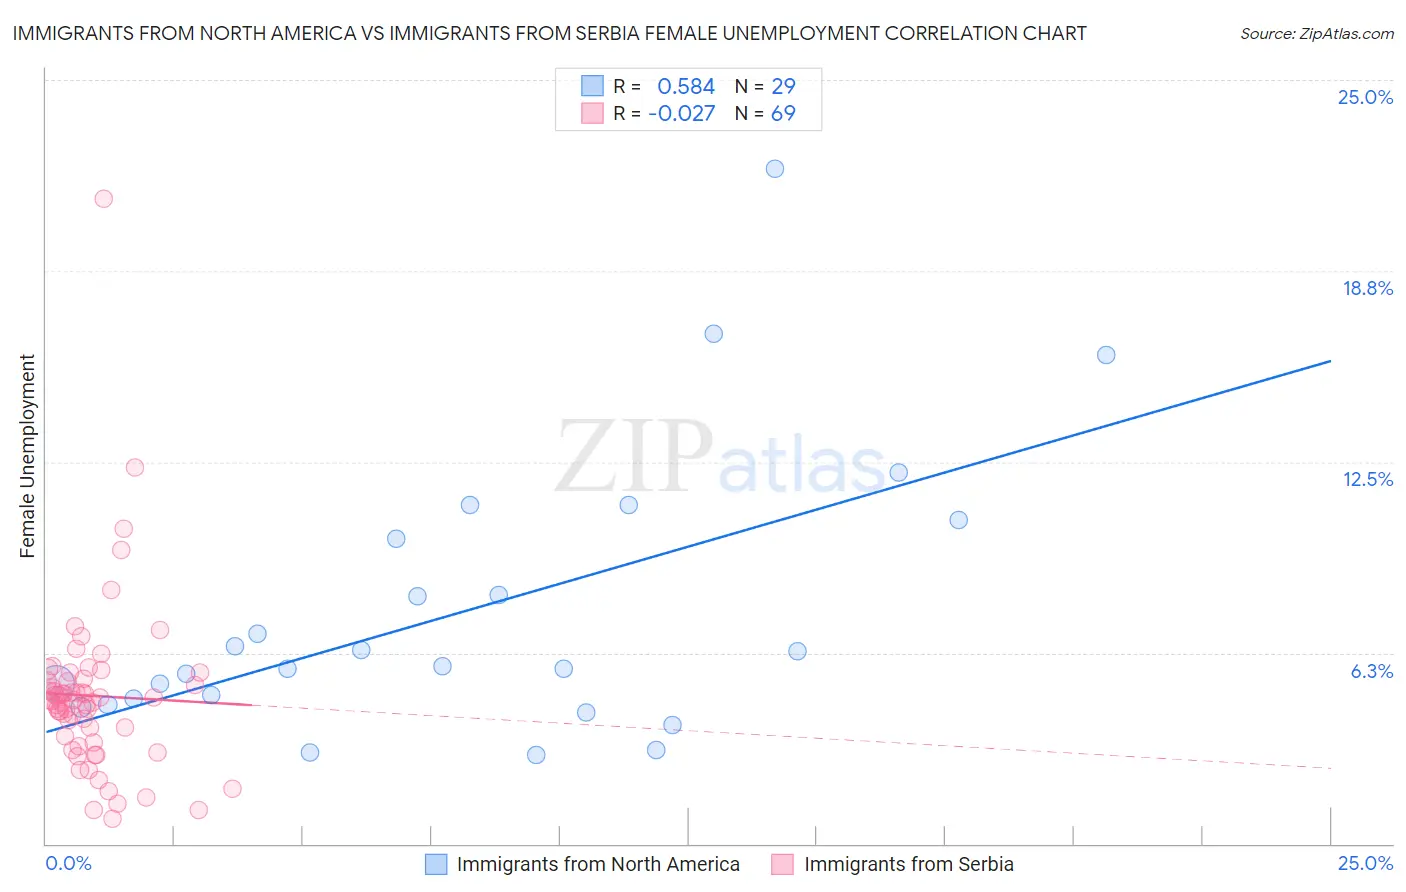
Immigrants from North America vs Immigrants from Serbia Female Unemployment Correlation Chart
The statistical analysis conducted on geographies consisting of 458,145,875 people shows a substantial positive correlation between the proportion of Immigrants from North America and unemploymnet rate among females in the United States with a correlation coefficient (R) of 0.584 and weighted average of 4.9%. Similarly, the statistical analysis conducted on geographies consisting of 131,575,347 people shows no correlation between the proportion of Immigrants from Serbia and unemploymnet rate among females in the United States with a correlation coefficient (R) of -0.027 and weighted average of 5.0%, a difference of 0.80%.
Female Unemployment Correlation Summary
| Measurement | Immigrants from North America | Immigrants from Serbia |
| Minimum | 2.9% | 0.80% |
| Maximum | 22.1% | 21.1% |
| Range | 19.2% | 20.3% |
| Mean | 7.6% | 4.8% |
| Median | 5.8% | 4.7% |
| Interquartile 25% (IQ1) | 4.6% | 3.4% |
| Interquartile 75% (IQ3) | 10.3% | 5.4% |
| Interquartile Range (IQR) | 5.7% | 1.9% |
| Standard Deviation (Sample) | 4.5% | 2.8% |
| Standard Deviation (Population) | 4.5% | 2.8% |
Demographics Similar to Immigrants from North America and Immigrants from Serbia by Female Unemployment
In terms of female unemployment, the demographic groups most similar to Immigrants from North America are Hungarian (4.9%, a difference of 0.030%), Cuban (4.9%, a difference of 0.030%), Tlingit-Haida (4.9%, a difference of 0.040%), Immigrants from Ireland (4.9%, a difference of 0.050%), and Osage (4.9%, a difference of 0.090%). Similarly, the demographic groups most similar to Immigrants from Serbia are Immigrants from Australia (5.0%, a difference of 0.020%), Canadian (5.0%, a difference of 0.040%), Filipino (5.0%, a difference of 0.070%), New Zealander (5.0%, a difference of 0.090%), and Turkish (5.0%, a difference of 0.21%).
| Demographics | Rating | Rank | Female Unemployment |
| Celtics | 98.5 /100 | #64 | Exceptional 4.9% |
| Immigrants | North America | 98.3 /100 | #65 | Exceptional 4.9% |
| Hungarians | 98.3 /100 | #66 | Exceptional 4.9% |
| Cubans | 98.3 /100 | #67 | Exceptional 4.9% |
| Tlingit-Haida | 98.3 /100 | #68 | Exceptional 4.9% |
| Immigrants | Ireland | 98.2 /100 | #69 | Exceptional 4.9% |
| Osage | 98.2 /100 | #70 | Exceptional 4.9% |
| German Russians | 98.1 /100 | #71 | Exceptional 4.9% |
| Immigrants | Northern Europe | 98.0 /100 | #72 | Exceptional 4.9% |
| Russians | 98.0 /100 | #73 | Exceptional 5.0% |
| Immigrants | Bolivia | 98.0 /100 | #74 | Exceptional 5.0% |
| Immigrants | Singapore | 98.0 /100 | #75 | Exceptional 5.0% |
| Immigrants | Venezuela | 97.9 /100 | #76 | Exceptional 5.0% |
| Mongolians | 97.8 /100 | #77 | Exceptional 5.0% |
| Immigrants | Netherlands | 97.8 /100 | #78 | Exceptional 5.0% |
| Turks | 97.6 /100 | #79 | Exceptional 5.0% |
| New Zealanders | 97.4 /100 | #80 | Exceptional 5.0% |
| Filipinos | 97.3 /100 | #81 | Exceptional 5.0% |
| Immigrants | Australia | 97.3 /100 | #82 | Exceptional 5.0% |
| Immigrants | Serbia | 97.2 /100 | #83 | Exceptional 5.0% |
| Canadians | 97.2 /100 | #84 | Exceptional 5.0% |