Immigrants from North America vs Immigrants from Eritrea Unemployment Among Ages 25 to 29 years
COMPARE
Immigrants from North America
Immigrants from Eritrea
Unemployment Among Ages 25 to 29 years
Unemployment Among Ages 25 to 29 years Comparison
Immigrants from North America
Immigrants from Eritrea
6.6%
UNEMPLOYMENT AMONG AGES 25 TO 29 YEARS
50.0/ 100
METRIC RATING
174th/ 347
METRIC RANK
5.9%
UNEMPLOYMENT AMONG AGES 25 TO 29 YEARS
99.9/ 100
METRIC RATING
20th/ 347
METRIC RANK
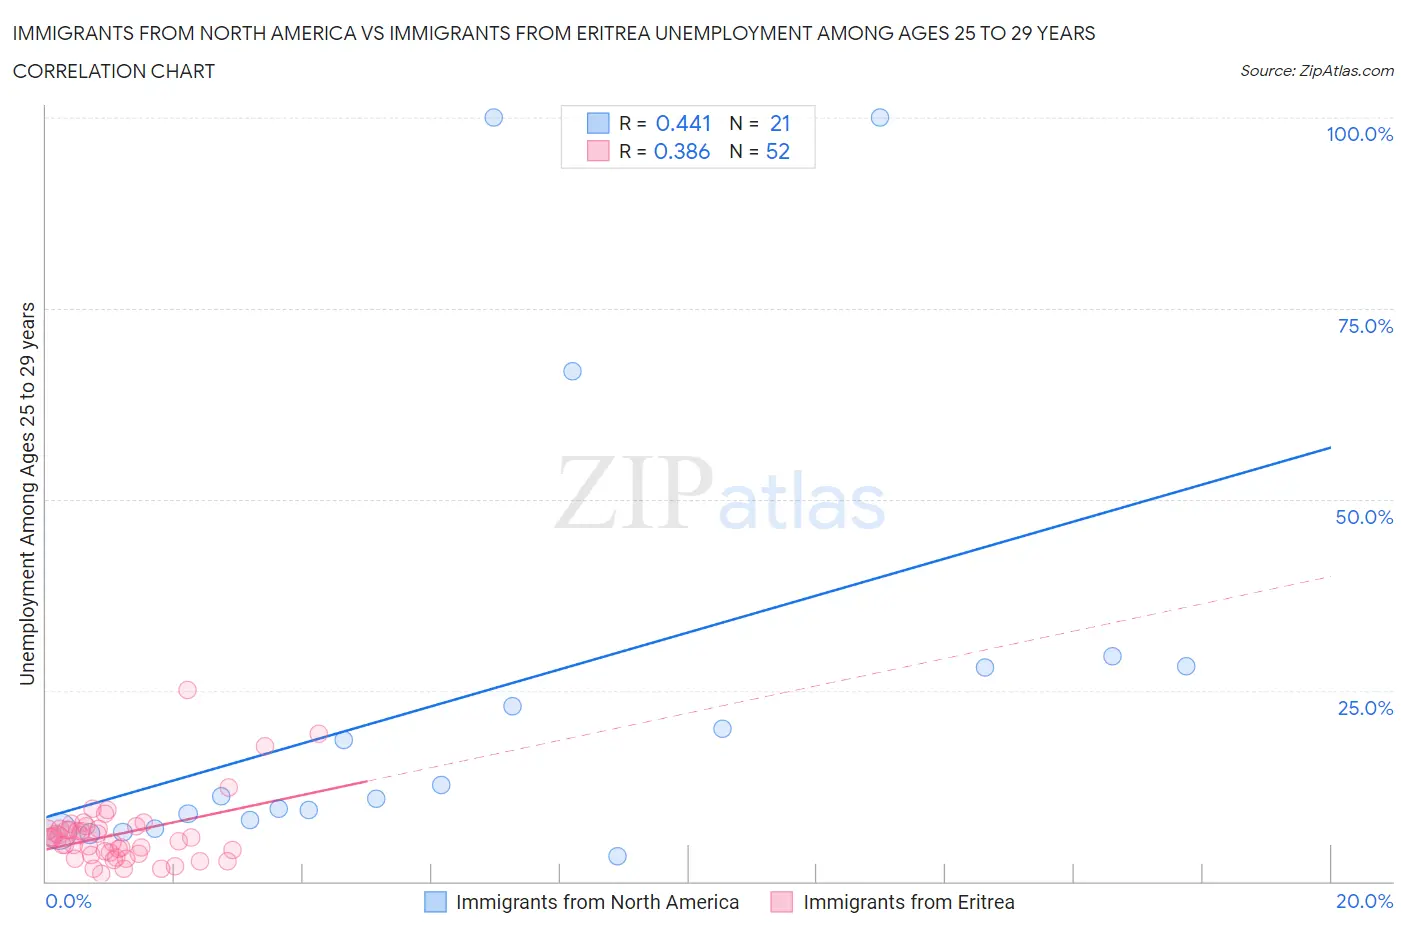
Immigrants from North America vs Immigrants from Eritrea Unemployment Among Ages 25 to 29 years Correlation Chart
The statistical analysis conducted on geographies consisting of 430,461,611 people shows a moderate positive correlation between the proportion of Immigrants from North America and unemployment rate among population between the ages 25 and 29 in the United States with a correlation coefficient (R) of 0.441 and weighted average of 6.6%. Similarly, the statistical analysis conducted on geographies consisting of 104,216,645 people shows a mild positive correlation between the proportion of Immigrants from Eritrea and unemployment rate among population between the ages 25 and 29 in the United States with a correlation coefficient (R) of 0.386 and weighted average of 5.9%, a difference of 11.8%.
Unemployment Among Ages 25 to 29 years Correlation Summary
| Measurement | Immigrants from North America | Immigrants from Eritrea |
| Minimum | 3.2% | 1.1% |
| Maximum | 100.0% | 25.0% |
| Range | 96.8% | 23.9% |
| Mean | 24.4% | 6.2% |
| Median | 11.1% | 5.7% |
| Interquartile 25% (IQ1) | 7.4% | 3.7% |
| Interquartile 75% (IQ3) | 28.1% | 6.9% |
| Interquartile Range (IQR) | 20.6% | 3.2% |
| Standard Deviation (Sample) | 28.7% | 4.3% |
| Standard Deviation (Population) | 28.0% | 4.3% |
Similar Demographics by Unemployment Among Ages 25 to 29 years
Demographics Similar to Immigrants from North America by Unemployment Among Ages 25 to 29 years
In terms of unemployment among ages 25 to 29 years, the demographic groups most similar to Immigrants from North America are Immigrants from South Eastern Asia (6.7%, a difference of 0.060%), Russian (6.6%, a difference of 0.080%), Bangladeshi (6.6%, a difference of 0.10%), Osage (6.7%, a difference of 0.12%), and Immigrants from Israel (6.7%, a difference of 0.14%).
| Demographics | Rating | Rank | Unemployment Among Ages 25 to 29 years |
| Immigrants | Canada | 55.0 /100 | #167 | Average 6.6% |
| Estonians | 54.8 /100 | #168 | Average 6.6% |
| South Americans | 54.5 /100 | #169 | Average 6.6% |
| Albanians | 53.5 /100 | #170 | Average 6.6% |
| Immigrants | Cambodia | 52.6 /100 | #171 | Average 6.6% |
| Bangladeshis | 51.6 /100 | #172 | Average 6.6% |
| Russians | 51.3 /100 | #173 | Average 6.6% |
| Immigrants | North America | 50.0 /100 | #174 | Average 6.6% |
| Immigrants | South Eastern Asia | 49.1 /100 | #175 | Average 6.7% |
| Osage | 48.1 /100 | #176 | Average 6.7% |
| Immigrants | Israel | 47.8 /100 | #177 | Average 6.7% |
| Immigrants | Iraq | 45.1 /100 | #178 | Average 6.7% |
| Costa Ricans | 44.9 /100 | #179 | Average 6.7% |
| Immigrants | Africa | 41.1 /100 | #180 | Average 6.7% |
| Immigrants | Western Europe | 41.1 /100 | #181 | Average 6.7% |
Demographics Similar to Immigrants from Eritrea by Unemployment Among Ages 25 to 29 years
In terms of unemployment among ages 25 to 29 years, the demographic groups most similar to Immigrants from Eritrea are Thai (5.9%, a difference of 0.18%), Immigrants from Singapore (5.9%, a difference of 0.34%), Immigrants from Ethiopia (6.0%, a difference of 0.34%), Bolivian (5.9%, a difference of 0.44%), and Immigrants from Bulgaria (5.9%, a difference of 0.58%).
| Demographics | Rating | Rank | Unemployment Among Ages 25 to 29 years |
| Immigrants | Bolivia | 100.0 /100 | #13 | Exceptional 5.9% |
| Immigrants | Kuwait | 99.9 /100 | #14 | Exceptional 5.9% |
| Cubans | 99.9 /100 | #15 | Exceptional 5.9% |
| Immigrants | Bulgaria | 99.9 /100 | #16 | Exceptional 5.9% |
| Bolivians | 99.9 /100 | #17 | Exceptional 5.9% |
| Immigrants | Singapore | 99.9 /100 | #18 | Exceptional 5.9% |
| Thais | 99.9 /100 | #19 | Exceptional 5.9% |
| Immigrants | Eritrea | 99.9 /100 | #20 | Exceptional 5.9% |
| Immigrants | Ethiopia | 99.9 /100 | #21 | Exceptional 6.0% |
| Immigrants | Japan | 99.9 /100 | #22 | Exceptional 6.0% |
| Immigrants | Venezuela | 99.8 /100 | #23 | Exceptional 6.0% |
| Norwegians | 99.8 /100 | #24 | Exceptional 6.0% |
| New Zealanders | 99.8 /100 | #25 | Exceptional 6.0% |
| Immigrants | Eastern Africa | 99.8 /100 | #26 | Exceptional 6.0% |
| Immigrants | Zaire | 99.7 /100 | #27 | Exceptional 6.0% |