Immigrants from Nigeria vs Cajun Unemployment Among Ages 35 to 44 years

COMPARE

Immigrants from Nigeria
Race
Ancestry
AfghanAfricanAlaska NativeAlaskan AthabascanAlbanianAleutAlsatianAmericanApacheArabArapahoArgentineanArmenianAssyrian/Chaldean/SyriacAustralianAustrianBahamianBangladeshiBarbadianBasqueBelgianBelizeanBermudanBhutaneseBlackfeetBolivianBrazilianBritishBritish West IndianBulgarianBurmeseCambodianCanadianCape VerdeanCarpatho RusynCelticCentral AmericanCentral American IndianCherokeeCheyenneChickasawChileanChineseChippewaChoctawColombianColvilleComancheCosta RicanCreeCreekCroatianCrowCubanCypriotCzechCzechoslovakianDanishDelawareDominicanDutchDutch West IndianEastern EuropeanEcuadorianEgyptianEnglishEstonianEthiopianEuropeanFijianFilipinoFinnishFrenchFrench American IndianFrench CanadianGermanGerman RussianGhanaianGreekGuamanian/ChamorroGuatemalanGuyaneseHaitianHmongHonduranHopiHoumaHungarianIcelanderIndian (Asian)IndonesianInupiatIranianIraqiIrishIroquoisIsraeliItalianJamaicanJapaneseJordanianKenyanKiowaKoreanLaotianLatvianLebaneseLiberianLithuanianLumbeeLuxembourgerMacedonianMalaysianMalteseMarshalleseMenomineeMexicanMexican American IndianMongolianMoroccanNative HawaiianNavajoNepaleseNew ZealanderNicaraguanNigerianNorthern EuropeanNorwegianOkinawanOsageOttawaPaiutePakistaniPalestinianPanamanianParaguayanPennsylvania GermanPeruvianPimaPolishPortuguesePotawatomiPuebloPuerto RicanPuget Sound SalishRomanianRussianSalvadoranSamoanScandinavianScotch-IrishScottishSeminoleSenegaleseSerbianShoshoneSierra LeoneanSiouxSlavicSlovakSloveneSomaliSouth AfricanSouth AmericanSouth American IndianSoviet UnionSpaniardSpanishSpanish AmericanSpanish American IndianSri LankanSubsaharan AfricanSudaneseSwedishSwissSyrianTaiwaneseThaiTlingit-HaidaTohono O'OdhamTonganTrinidadian and TobagonianTsimshianTurkishU.S. Virgin IslanderUgandanUkrainianUruguayanUteVenezuelanVietnameseWelshWest IndianYakamaYaquiYugoslavianYumanYup'ikZimbabwean
Immigration
NonimmigrantsImmigrantsAfghanistanAfricaAlbaniaArgentinaArmeniaAsiaAustraliaAustriaBahamasBangladeshBarbadosBelarusBelgiumBelizeBoliviaBosnia and HerzegovinaBrazilBulgariaBurma/MyanmarCabo VerdeCambodiaCameroonCanadaCaribbeanCentral AmericaChileChinaColombiaCongoCosta RicaCroatiaCubaCzechoslovakiaDenmarkDominicaDominican RepublicEastern AfricaEastern AsiaEastern EuropeEcuadorEgyptEl SalvadorEnglandEritreaEthiopiaEuropeFijiFranceGermanyGhanaGreeceGrenadaGuatemalaGuyanaHaitiHondurasHong KongHungaryIndiaIndonesiaIranIraqIrelandIsraelItalyJamaicaJapanJordanKazakhstanKenyaKoreaKuwaitLaosLatin AmericaLatviaLebanonLiberiaLithuaniaMalaysiaMexicoMicronesiaMiddle AfricaMoldovaMoroccoNepalNetherlandsNicaraguaNigeriaNorth AmericaNorth MacedoniaNorthern AfricaNorthern EuropeNorwayOceaniaPakistanPanamaPeruPhilippinesPolandPortugalRomaniaRussiaSaudi ArabiaScotlandSenegalSerbiaSierra LeoneSingaporeSomaliaSouth AfricaSouth AmericaSouth Central AsiaSouth Eastern AsiaSouthern EuropeSpainSri LankaSt. Vincent and the GrenadinesSudanSwedenSwitzerlandSyriaTaiwanThailandTrinidad and TobagoTurkeyUgandaUkraineUruguayUzbekistanVenezuelaVietnamWest IndiesWestern AfricaWestern AsiaWestern EuropeYemenZaireZimbabweAzores
Cajun
Race
Ancestry
AfghanAfricanAlaska NativeAlaskan AthabascanAlbanianAleutAlsatianAmericanApacheArabArapahoArgentineanArmenianAssyrian/Chaldean/SyriacAustralianAustrianBahamianBangladeshiBarbadianBasqueBelgianBelizeanBermudanBhutaneseBlackfeetBolivianBrazilianBritishBritish West IndianBulgarianBurmeseCajunCambodianCanadianCape VerdeanCarpatho RusynCelticCentral AmericanCentral American IndianCherokeeCheyenneChickasawChileanChineseChippewaChoctawColombianColvilleComancheCosta RicanCreeCreekCroatianCrowCubanCypriotCzechCzechoslovakianDanishDelawareDominicanDutchDutch West IndianEastern EuropeanEcuadorianEgyptianEnglishEstonianEthiopianEuropeanFijianFilipinoFinnishFrenchFrench American IndianFrench CanadianGermanGerman RussianGhanaianGreekGuamanian/ChamorroGuatemalanGuyaneseHaitianHmongHonduranHopiHoumaHungarianIcelanderIndian (Asian)IndonesianInupiatIranianIraqiIrishIroquoisIsraeliItalianJamaicanJapaneseJordanianKenyanKiowaKoreanLaotianLatvianLebaneseLiberianLithuanianLumbeeLuxembourgerMacedonianMalaysianMalteseMarshalleseMenomineeMexicanMexican American IndianMongolianMoroccanNative HawaiianNavajoNepaleseNew ZealanderNicaraguanNigerianNorthern EuropeanNorwegianOkinawanOsageOttawaPaiutePakistaniPalestinianPanamanianParaguayanPennsylvania GermanPeruvianPimaPolishPortuguesePotawatomiPuebloPuerto RicanPuget Sound SalishRomanianRussianSalvadoranSamoanScandinavianScotch-IrishScottishSeminoleSenegaleseSerbianShoshoneSierra LeoneanSiouxSlavicSlovakSloveneSomaliSouth AfricanSouth AmericanSouth American IndianSoviet UnionSpaniardSpanishSpanish AmericanSpanish American IndianSri LankanSubsaharan AfricanSudaneseSwedishSwissSyrianTaiwaneseThaiTlingit-HaidaTohono O'OdhamTonganTrinidadian and TobagonianTsimshianTurkishU.S. Virgin IslanderUgandanUkrainianUruguayanUteVenezuelanVietnameseWelshWest IndianYakamaYaquiYugoslavianYumanYup'ikZimbabwean
Immigration
NonimmigrantsImmigrantsAfghanistanAfricaAlbaniaArgentinaArmeniaAsiaAustraliaAustriaBahamasBangladeshBarbadosBelarusBelgiumBelizeBoliviaBosnia and HerzegovinaBrazilBulgariaBurma/MyanmarCabo VerdeCambodiaCameroonCanadaCaribbeanCentral AmericaChileChinaColombiaCongoCosta RicaCroatiaCubaCzechoslovakiaDenmarkDominicaDominican RepublicEastern AfricaEastern AsiaEastern EuropeEcuadorEgyptEl SalvadorEnglandEritreaEthiopiaEuropeFijiFranceGermanyGhanaGreeceGrenadaGuatemalaGuyanaHaitiHondurasHong KongHungaryIndiaIndonesiaIranIraqIrelandIsraelItalyJamaicaJapanJordanKazakhstanKenyaKoreaKuwaitLaosLatin AmericaLatviaLebanonLiberiaLithuaniaMalaysiaMexicoMicronesiaMiddle AfricaMoldovaMoroccoNepalNetherlandsNicaraguaNorth AmericaNorth MacedoniaNorthern AfricaNorthern EuropeNorwayOceaniaPakistanPanamaPeruPhilippinesPolandPortugalRomaniaRussiaSaudi ArabiaScotlandSenegalSerbiaSierra LeoneSingaporeSomaliaSouth AfricaSouth AmericaSouth Central AsiaSouth Eastern AsiaSouthern EuropeSpainSri LankaSt. Vincent and the GrenadinesSudanSwedenSwitzerlandSyriaTaiwanThailandTrinidad and TobagoTurkeyUgandaUkraineUruguayUzbekistanVenezuelaVietnamWest IndiesWestern AfricaWestern AsiaWestern EuropeYemenZaireZimbabweAzores
Unemployment Among Ages 35 to 44 years
Income
Poverty
Unemployment
Labor Participation
Family Structure
Vehicle Availability
Education Level
Disability

Unemployment Among Ages 35 to 44 years Comparison

Immigrants from Nigeria

Cajuns

Tragic
Tragic
5.1%
UNEMPLOYMENT AMONG AGES 35 TO 44 YEARS
1.2/ 100
METRIC RATING
233rd/ 347
METRIC RANK
5.3%
UNEMPLOYMENT AMONG AGES 35 TO 44 YEARS
0.0/ 100
METRIC RATING
269th/ 347
METRIC RANK

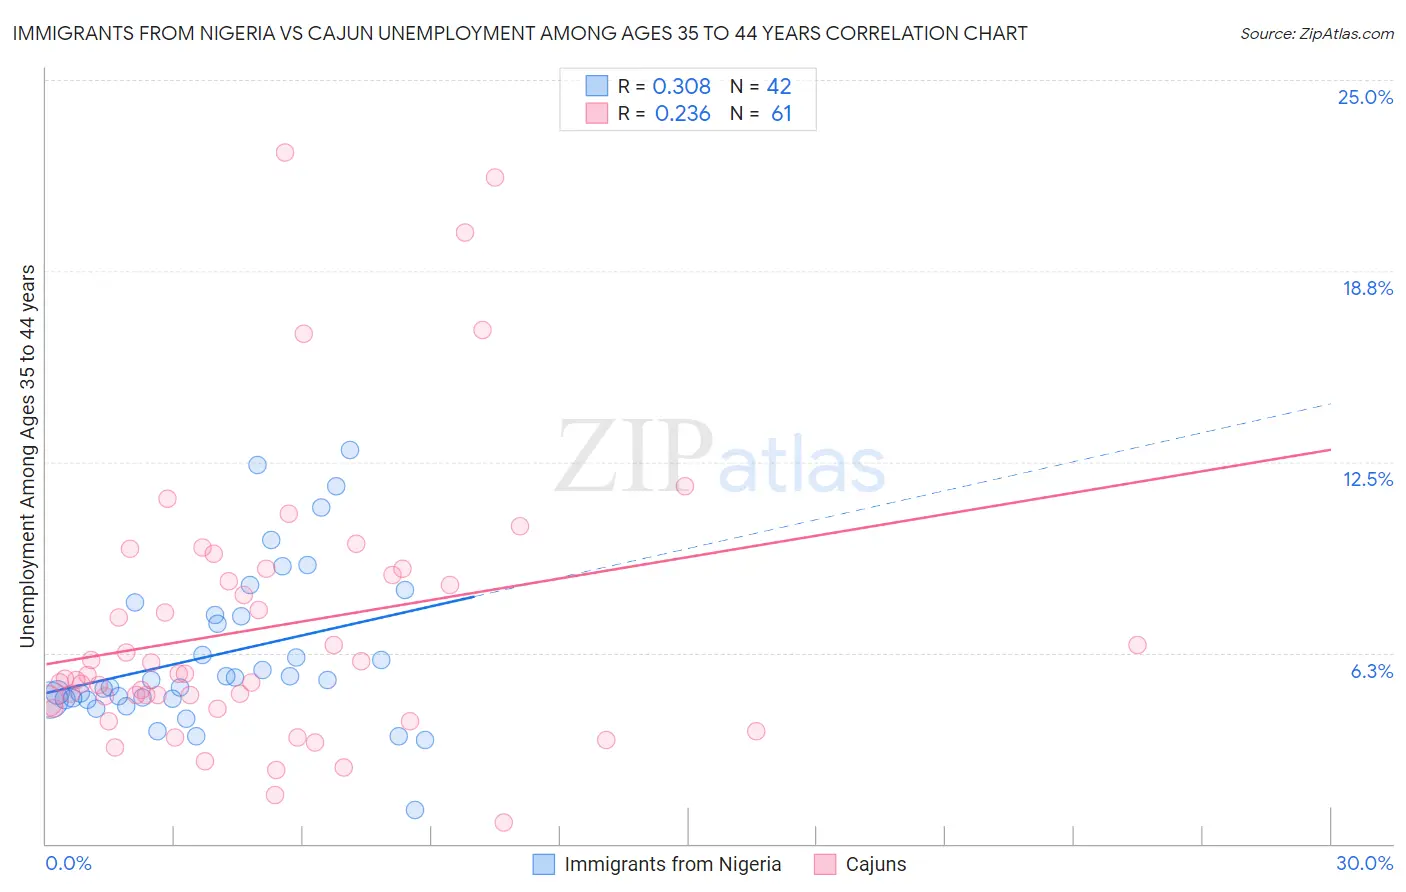
Immigrants from Nigeria vs Cajun Unemployment Among Ages 35 to 44 years Correlation Chart

The statistical analysis conducted on geographies consisting of 280,306,541 people shows a mild positive correlation between the proportion of Immigrants from Nigeria and unemployment rate among population between the ages 35 and 44 in the United States with a correlation coefficient (R) of 0.308 and weighted average of 5.1%. Similarly, the statistical analysis conducted on geographies consisting of 147,202,626 people shows a weak positive correlation between the proportion of Cajuns and unemployment rate among population between the ages 35 and 44 in the United States with a correlation coefficient (R) of 0.236 and weighted average of 5.3%, a difference of 5.3%.
Immigrants from Nigeria vs Cajun Unemployment Among Ages 35 to 44 years

Unemployment Among Ages 35 to 44 years Correlation Summary

MeasurementImmigrants from NigeriaCajun
Minimum1.1%0.70%
Maximum12.9%22.6%
Range11.8%21.9%
Mean6.2%7.1%
Median5.4%5.5%
Interquartile 25% (IQ1)4.7%4.5%
Interquartile 75% (IQ3)7.5%8.9%
Interquartile Range (IQR)2.8%4.3%
Standard Deviation (Sample)2.6%4.5%
Standard Deviation (Population)2.6%4.5%

Similar Demographics by Unemployment Among Ages 35 to 44 years

Demographics Similar to Immigrants from Nigeria by Unemployment Among Ages 35 to 44 years

In terms of unemployment among ages 35 to 44 years, the demographic groups most similar to Immigrants from Nigeria are Iroquois (5.1%, a difference of 0.050%), Portuguese (5.1%, a difference of 0.060%), Japanese (5.1%, a difference of 0.13%), Liberian (5.1%, a difference of 0.16%), and Guamanian/Chamorro (5.1%, a difference of 0.33%).
DemographicsRating | RankUnemployment Among Ages 35 to 44 years
Potawatomi
2.5
/100
|
#226
Tragic
5.0%
Immigrants | Uzbekistan
1.9
/100
|
#227
Tragic
5.0%
Samoans
1.8
/100
|
#228
Tragic
5.0%
Immigrants | Cambodia
1.5
/100
|
#229
Tragic
5.0%
Liberians
1.3
/100
|
#230
Tragic
5.1%
Japanese
1.2
/100
|
#231
Tragic
5.1%
Iroquois
1.2
/100
|
#232
Tragic
5.1%
Immigrants | Nigeria
1.2
/100
|
#233
Tragic
5.1%
Portuguese
1.1
/100
|
#234
Tragic
5.1%
Guamanians/Chamorros
0.9
/100
|
#235
Tragic
5.1%
Central Americans
0.8
/100
|
#236
Tragic
5.1%
Kiowa
0.8
/100
|
#237
Tragic
5.1%
Hondurans
0.7
/100
|
#238
Tragic
5.1%
Nigerians
0.7
/100
|
#239
Tragic
5.1%
Somalis
0.7
/100
|
#240
Tragic
5.1%

Demographics Similar to Cajuns by Unemployment Among Ages 35 to 44 years

In terms of unemployment among ages 35 to 44 years, the demographic groups most similar to Cajuns are Hawaiian (5.3%, a difference of 0.010%), Immigrants from Western Africa (5.3%, a difference of 0.090%), Blackfeet (5.3%, a difference of 0.14%), Immigrants from Bangladesh (5.3%, a difference of 0.21%), and Yaqui (5.3%, a difference of 0.23%).
DemographicsRating | RankUnemployment Among Ages 35 to 44 years
Immigrants | Central America
0.1
/100
|
#262
Tragic
5.3%
Choctaw
0.1
/100
|
#263
Tragic
5.3%
Ghanaians
0.1
/100
|
#264
Tragic
5.3%
Yaqui
0.1
/100
|
#265
Tragic
5.3%
Immigrants | Bangladesh
0.1
/100
|
#266
Tragic
5.3%
Immigrants | Western Africa
0.0
/100
|
#267
Tragic
5.3%
Hawaiians
0.0
/100
|
#268
Tragic
5.3%
Cajuns
0.0
/100
|
#269
Tragic
5.3%
Blackfeet
0.0
/100
|
#270
Tragic
5.3%
Ute
0.0
/100
|
#271
Tragic
5.3%
Senegalese
0.0
/100
|
#272
Tragic
5.3%
Vietnamese
0.0
/100
|
#273
Tragic
5.4%
Creek
0.0
/100
|
#274
Tragic
5.4%
Immigrants | Mexico
0.0
/100
|
#275
Tragic
5.4%
Native Hawaiians
0.0
/100
|
#276
Tragic
5.4%